
Freeway Management and Operations Handbook
Chapter 8 – Managed Lanes
Page 1 of 2
8.1 Introduction
Managed lanes (Figure 8-1 as an example) involve the regulation, warning, guidance and redistribution of traffic to meet such overall goals as:
- Improve traffic operations
- Facilitate movement of people and goods
- Improve safety
- Generate revenue
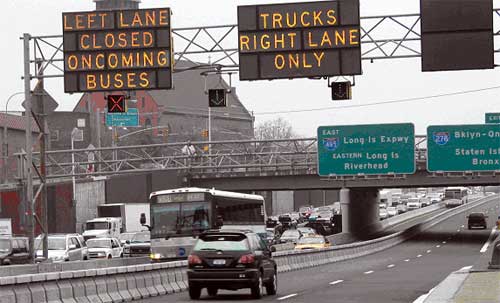
Figure 8-1: Example of Managed Lanes
Managed lanes are certain freeway lanes set aside for a variety of operating strategies that move traffic more efficiently in those lanes. As a result, travelers have options in traveling on a congested freeway. High-occupancy vehicle (HOV) lanes (See Chapter 9) are examples of managed lanes. The concept of HOV-only lanes is evolving into a new type of facility that offers more choices and more flexibility for a wider range of freeway users.
The Texas Department of Transportation works to the following definition (1):
"A managed lane facility is one that increases freeway efficiency by packaging various operational and design actions. Lane management operations may be adjusted at any time to better match regional goals."
Managed lanes can improve the safety and efficiency of freeway operations. Managed lanes have typically encompassed such methods as:
- Static signing and striping (Discussed in Chapter 6)
- Changeable message signs. (Discussed in Chapter 13)
- Lane control signals.
- Temporary traffic control devices.
- Law enforcement / legal restrictions.
- Economic incentives / disincentives.
Agencies often combine these methods into an effective subsystem from both a safety and operations perspective. Examples include:
- Appropriate static signing and temporary "traffic control devices to temporarily close a travel lane for maintenance or construction activity (2).
- Static signing to notify drivers that large trucks are restricted to certain travel lanes and police enforce those restrictions.
- Upstream dynamic message signs to encourage diversion from the freeway or reinforce warning of a downstream lane closure.
- Reversible lanes (zipper lanes in some deployments) to accommodate highly directional demand.
- Tolls that vary by time of day or by demand to mitigate peak period congestion.
8.1.1 Purpose of Chapter
This chapter provides:
- A systematic approach to the development of a managed lane subsystem.
- A summary and description of various managed lane strategies and technologies.
- Insight into issues associated with managed lane subsystems.
The chapter addresses several of the key activities for developing a freeway management program (as discussed in Chapter 3) to determine an effective managed lanes system approach. The chapter proceeds to describe specific strategies and technologies, addresses special issues associated with design and implementation and concludes with some examples of managed lane subsystems.
8.1.2 Relationship to Other Freeway Management Activities
This chapter closely relates to several other chapters in the Handbook. Chapter 3, Freeway Management Programs and Projects, (in particular the section on systems engineering), provides the overall framework guiding all freeway management systems, including the managed lane subsystems discussed in this chapter. Since the development of managed lanes often requires roadway improvements, Chapter 5, Roadway Improvements, can prove relevant. Managed lanes often include additional static signing and striping which is covered in Chapter 6, Other Roadway Improvements. Chapter 7, Ramp Management and Control, is related as well since control of ramp traffic is key to maintaining mainline flow. In that chapter, the section on Freeway-to-Freeway Ramp Metering is particularly pertinent. Chapter 9, High Occupancy Vehicle Treatments, relates to this chapter since HOV lanes represent a specific form of lane management. Since managed lanes become particularly important when incidents occur, Chapter 10, Traffic Incident Management, also is related. Finally, Chapter 13, Information Dissemination, describes technologies frequently used for managed lanes.
8.2 Current Practices, Methods, Strategies, and Technologies
8.2.1 Overview
At the most basic level, the problems treated via managed lanes are similar to those specified for other freeway management subsystems. These include excessive peak period directional demands that result in congestion, safety problems, and excessive vehicle emissions that degrade the air quality of a region. The specific types of problems usually treated through managed lanes include:
- One or more lanes must be closed to all traffic for some period of time (due to scheduled work activity or an incident).
- One or more types of vehicles need to be separated from each other in one or more lanes.
- Flow on one or more lanes needs to be reversed to accommodate directional peak demands.
- Speeds or flow rates in certain lanes are judged to be too high for safe and efficient operations.
- Traffic must be safely routed through a work zone
The following strategies can be applied to managed lanes:
- Truck lanes
- HOV lanes
- Use of narrow lanes and shoulders
- Contraflow lanes
- Reversible lanes
- Mainline metering
- Speed advisories and controls
- Work zone controls
- Toll Facilities
- Congestion pricing
8.2.2 Benefits
Examples of objectives that managed lanes can address include:
- Reduce the frequency of collisions caused when motorists encounter congested conditions, work zones, or incidents.
- Improve throughput and / or reduce emissions by achieving more uniform and stable traffic flow as demand approaches capacity. This uses the freeway more efficiently and retards or prevents the onset of congestion.
- Improve reliability of travel times for certain classes of travelers
- Distribute total delay in a more equitable manner, preserving some capacity for downstream segments.
- Increase the efficiency of operation under reduced capacity conditions caused by incidents or maintenance operations.
- Divert some freeway traffic to alternative routes or encourage alternative departure times to better use corridor capacity. This will reduce peak-period traffic demand on the freeway.
- Provide a travel time incentive to high-occupancy vehicles.
- Extend pavement life (by restricting trucks from particular lanes).
Specific benefits for the various lane management strategies are discussed in subsequent sections.
8.2.3 Key Considerations During Freeway Management Program Development
The basic steps outlined in Chapter 3, and particularly the section on systems engineering, apply to the development of a managed lanes subsystem. As discussed in that section, before developing the concepts of a particular system, some preliminary steps are necessary – specifically, understanding the local institutional environment, and identifying stakeholders.
The institutional environment includes what can realistically be done in the realm of managed lane concepts, receptivity to innovation and new ways of doing business, willingness to invest in managed lane solutions, and local laws and regulations that may impact the operation of managed lanes.
To properly perform a needs analysis and complete a concept of operations, the stakeholders or potential partners in managing this subsystem must be identified. Ultimately a consensus must be reached among them as to how the system will operate. This consensus assumes particular importance, as some lane management strategies require legislation and enforcement to implement. The support of enforcement agencies becomes essential to the success of the strategy.
Stakeholders involved in managed lanes will vary depending on the identified problems and treatments but will likely include:
- State and local DOTs.
- State and local law enforcement agencies.
- Elected officials.
- Citizens committees.
- Transit agencies.
- Trucking companies.
- Private contractors.
After identifying the stakeholders affected by managed lane actions, a consensus about the problems and need for solutions must be developed. Early on, it is critical to establish support from elected officials and the general public for managed lane concepts. This is particularly important when not all motorists are affected equally by the actions that may be implemented (via tolls, lane restrictions for certain vehicles, etc.). Support is also needed from upper management at each of the agencies identified.
Concern over the interaction between automobiles and trucks on freeway
facilities often becomes a controversial aspect of freeway management.
Trucking companies have usually demonstrated a willingness to work with
public transportation and enforcement agencies to develop compromises
on when and where trucks will travel during peak periods, major freeway
construction activities, or special events (3).
Consequently, trucking companies can serve as crucial stakeholders in
managed lanes.
After identification of the stakeholders, the next step in developing
a lane management and control subsystem is preparation of a concept of
operations as described in Chapters 3 and
14. The concept of operations begins with
a description of the current system or situation. This includes a needs
analysis (i.e. a consensus on what are the problems or situations that
need to be addressed through this subsystem.) The needs analysis should
articulate the identified problems and their degree of severity. This
will help shape the program to include the most cost effective strategies.
It is important that the concept of operations broadly defines the proposed managed lanes system. The concept of operations must take into account the political sensitivities and ramifications of the alternative features. Alternatives that adversely impact some motorists to the advantage to other motorists have typically met resistance. Alternatives that involve direct cash outlays, such as toll facilities or congestion pricing schemes, have also met resistance. These alternatives require more public outreach and political interaction among the stakeholders to ensure that they will prove successful if implemented.
8.2.4 Relationship to National ITS Architecture
As indicated in Chapter 3, the National ITS Architecture (4) provides a common structure or framework to promote compatibility and interoperability among systems, products, and services.
Market packages relevant to managed lanes include:
- Freeway Control
- HOV Lane Management
- Traffic Information Dissemination
- Incident Management System
- Electronic Toll Collection
- Reversible Lane Management
- Speed Monitoring
- In-Vehicle Signing
- Automated Highway System
- Work Zone Management
8.2.5 Strategies
This section describes strategies frequently used to manage freeway lanes.
8.2.5.1 Truck Lanes
The goals of various forms of truck lanes are to improve traffic operations, improve safety and facilitate the flow of goods (5). Truck lanes fall into the following categories:
- Lane restrictions
- Separated roadways
- Dedicated roadways
- Interchange bypass lanes
- Climbing lanes
Lane restrictions typically prohibit trucks from using the far left lane. At least 3 travel lanes are normally needed to implement lane restrictions. Several States adopted this type of lane restriction because trucks were often observed traveling abreast across several lanes, denying passing opportunities for other vehicles. Also, to provide for uniform pavement wear, trucks are sometimes restricted from the right lanes. Lane restrictions through construction zones are used to move the trucks away from workers and from narrower lanes. Table 8-1 (6) is a summary of experience regarding lane restrictions in various states and in research studies.
| Location / Study | Conditions | Results / Comments |
|---|---|---|
| Florida I-95, Broward County | Conducted a 6 month, 7 am to 7 pm study in 1988 | Public feels safer with lane restrictions for trucks. Overall accidents up 6.3 percent (7 am to 7 pm period); truck accidents down 3.3 percent. |
| Georgia | Beginning Sept. 1986, trucks were restricted to the right lane(s) except to pass or to make a left-hand exit. | On I-285, trucks were at fault in 72 percent of lane-changing violations. Before the restriction, trucks were observed occupying all lanes thus prohibiting passing. |
| New Jersey | Turnpike Authority (NJTA) imposed lane restrictions in the 1960's. Restrictions do not allow trucks in the left lane of turnpike roadways that have three or more lanes by direction. | Sources at the NJTA stated that the compliance rate for truck lane restrictions is very high. |
| Illinois | Began in 1964. | Public feels safer, and better operations. |
| Maryland Capital Beltway | Believes to have been implemented as a reaction to a major truck accident. | Public feels safer. Effects on safety not well known. |
| Virginia Capital Beltway | Four studies, one for 24-months, others for 12 months. | Public and political perception: safer highways. Engineering study recommended removal. Accident rate increased 13.8 percent during 2-yr. Study. Second study also showed increase. |
| Michigan | Statewide restrictions require trucks to use the right two lanes on roadways that have three or more lanes. | Establishment was thought to be politically motivated. No studies available to evaluate the countermeasure. |
| Garber Study | Simulation based on data from nine sites. | Decreased headways in right lane. Slight increase in right lane accidents. |
| Hanscom Study (23) | Two 3-lane suburban sites, all <100,000 AADT. | Beneficial traffic operations and reduced congestion. |
A survey of State practice in 1986 by the FHWA (7) identified the most common reasons given for using truck lane restrictions:
- To improve operations (fourteen States).
- To reduce accidents (eight States).
- For pavement structural considerations (seven States).
- Because of restrictions in construction zones (five States).
Truck restrictions can be implemented in a number of other ways as well. Table 8-2 (8) summarizes the constraints and impacts of different types of restrictions.
| Action | Constraints/Limitations | Impacts |
|---|---|---|
| Lane Restrictions |
|
|
| Time-of-Day Restrictions |
|
|
| Speed Restrictions |
|
|
| Route Restrictions |
|
|
| Driver Training / Certification |
|
|
| Increased Enforcement of Existing Regulations |
|
|
A recent project in Houston implemented a truck restriction lane on an eight-mile section of the I-10 East Freeway (9). The study reported a 68 percent reduction in crashes over a 36-week period. A truck restriction lane on I-40 near Knoxville resulted in a substantial reduction in the percentage of trucks traveling the left lane even with minimal sign usage and enforcement (10).
Separated roadways for trucks are less common. A well-known example is the New Jersey Turnpike, which features completely separated roadways, one reserved for passenger cars only, and the other open to both commercial and non-commercial traffic. Figure 8-2 shows a dual-dual section of the Turnpike. The data in Figure 8-3 shows that the dual-dual portions of the NJ Turnpike enjoy lower accident rates than the sections where commercial traffic is not separated.
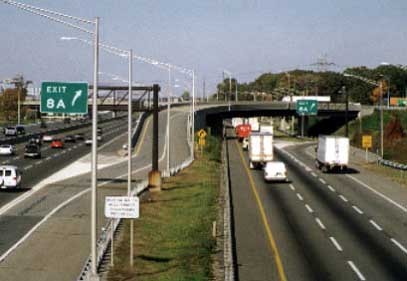
Figure 8-2: Dual-dual Section of New Jersey Turnpike
Figure 8-3: Accident Data on New Jersey Turnpike D
Dedicated roadways for trucks are even less common. One example is the South Boston Bypass Road, a two lane undivided roadway with no shoulders. The SBBR is restricted to commercial vehicles only – including taxis, jitneys, limos, and automobiles with commercial plates. The restriction was instituted to mitigate noise and emissions by siphoning truck traffic from I-93 through an industrial edge of South Boston. The roadway reduces demand on a saturated I-93 through the middle of downtown Boston and usually operates with free flowing heavy truck traffic.
Climbing lanes typically are built to improve operations on grades by separating slow moving heavy vehicles from the rest of traffic. These lanes have become a common practice and AASHTO (11) provides established criteria. Additional information is provided in Chapter 5.
Interchange bypass lanes have been implemented in Southern California and Portland, Oregon to route trucks around a major merge, thereby improving traffic operations at the interchange. Figure 8-4 shows such a bypass lane at the I-5 / I-405 interchange in Los Angeles.
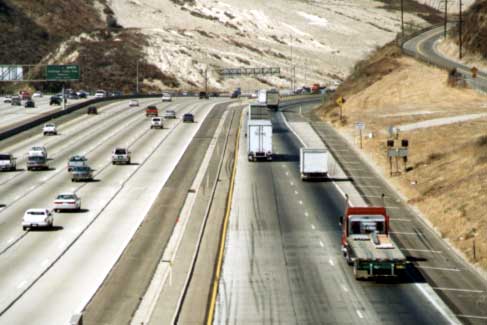
Figure 8-4: I-5 Truck Bypass, Los Angeles
8.2.5.2 HOV Lanes
Another form of managed lanes is the dedication of a lane(s) to high-occupancy vehicles only. (For discussion of high occupancy vehicle lanes, see Chapter 9 (High Occupancy Vehicle Treatments).
Entire roadways have been restricted to HOV use on an emergency basis. In the wake of the terrorist attacks of September 11, 2001, New York City required vehicles entering bridges and tunnels south of 63rd Street in Manhattan to have at least 2 occupants (See Figure 8-5). This was to reduce traffic congestion due to heightened security checks of vehicles using these facilities.
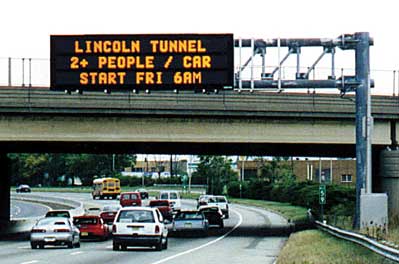
Figure 8-5: HOV Restrictions into NYC During Period
Following September 11, 2001
8.2.5.3 Use of Narrow Lanes and Shoulders
Research has confirmed that shoulders and narrow lanes can be used effectively to increase capacity in congested metropolitan corridors. This strategy is discussed in Chapter 5 herein and in Reference 12.
8.2.5.4 Contraflow Lanes
A contraflow lane is a freeway lane in the off-peak direction of flow (normally adjacent to the median) that is designated for use by HOVs traveling in the direction of peak flow for at least a portion of the day (See Chapter 9). They may also be used during major evacuations as discussed in Chapter 12. Normally, the contraflow lane is separated from the off-peak (or opposite) flow by insertable cones, pylons, or movable concrete barriers.
Application of contraflow lanes has been limited to areas of extreme congestion where directional flow imbalance permits their use. This approach is sometimes used as an interim measure during the definition and development of long-range solutions. Table 8-3 describes two contraflow projects in the New York / New Jersey metropolitan area on severely congested approaches to tunnels.
Disadvantages of freeway contraflow lanes include:
- Labor-intensive daily operations to set out and retrieve traffic
cones used as lane delineation markers, and
- Contraflow freeway HOV lanes tend to have low accident rates but high severity indices; capacity reduction in off-peak direction typically increases accident rate in that direction (Reference 13)
8.2.5.5 Reversible Lanes
To best use existing facilities, a number of jurisdictions have instituted reversible-lane flow (also known in Europe as tidal flow lanes). Reversible lanes change the directional capacity of a freeway to accommodate peak directional traffic demands. To warrant reversible lanes, peak-period traffic volumes should exhibit or anticipated to exhibit significant directional imbalance (e.g., 70/30 percent, Reference 40). If warranted, reversible lanes can use right-of-way more efficiently and economically. Figure 8-6 illustrates an example of the directional peaks that reversible lanes can mitigate.
Figure 8-6: Directional Peaks Potentially Mitigated by Reversible Lanes D
Reversible lanes on a freeway have usually been implemented on a roadway cross-section that includes a completely separated set of lanes in the center of the freeway. These are reversed in accordance with peak demands usually on a time-of-day basis.
An example is the set of reversible express lanes (lanes that do not have access to and from all interchanges) on San Diego's I-15 which have been in operation for 14 years. The reversible 2-lane facility is located between the Ted Williams exit (SR-56) to the north and the SR-163 exit to the south. This facility has three operational barrier gates that are open from 5:45 am to 9:15 am for the morning peak inbound, (southbound), and from 3:00 pm to 7:00 pm for the evening peak outbound, (northbound). The I-15 HOV facility uses both lanes in the same direction for each operational period and is open to the following vehicles:
- 2+ person carpools
- 2+ person vanpools
- Buses
- Motorcycles
On weekends, the I-15 HOV facility is normally not open / used except in extenuating circumstances. As a result of a managed lanes initiative, the lanes are now open to single occupant vehicles (SOVs) as part of the Congestion Pricing / HOT Lane initiative. (See section 8.2.5.10 and Chapter 9).
In addition to the three barrier gates, the equipment that operates the facility includes pop-up lane delimiters for lane control, video cameras, vehicle detection, lighting, and 12 CMS signs. The configuration is shown in Figure 8-7.
Figure 8-7: Schematic of I-15 Reversible Lanes D
Separated reversible lanes have also been designed and implemented on the Kennedy Expressway in Chicago, Interstates 5 and 90 in Seattle, and the Shirley Highway in Northern Virginia (See Figure 8-8).
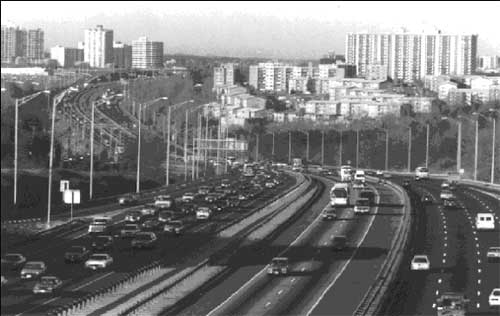
Figure 8-8: Shirley Highway (I-395 Northern Virginia) Median Reversible Lanes
The Kennedy Expressway has a 7-mile, two-lane reversible roadway in the median strip. The reversible lanes serve as express lanes and have only one access between their terminals for outbound-only flow. The outer roadways have three to four lanes and operate in only one direction.
Interstate 5 on the northern approach to Seattle has a 7.5-mile reversible-lane section in the median. However, the reversible lanes are not express and have several interchange points. The major features of this system include:
- The only transfer points between the reversible-lane section and the outer roadways are at the two ends of the section. The other seven interchanges are direct transfers between the reversible lanes and the arterial street system.
- The ramp connections to the reversible roadway are controlled by devices
that include:
- Swing gates,
- Changeable message signs to inform the motorist of the current operating direction.
These devices are activated locally at each ramp site. To help motorists become familiar with the system, lane reversal is usually performed at the same time each weekday (with weekend hours varying slightly from the weekday).
Reversible lanes not using a completely separated set of lanes are often used in tunnel and bridge operations for:
- Assigning roadway lanes to prevailing directional traffic flow requirements,
- Balancing traffic flow during maintenance operations, and
- An element in incident response plans.
The center lane of the San Diego Coronado Bridge is reversible along its 1.6-mile length. The configuration is changed twice a day to accommodate peak hours (3 lanes in the peak direction and 2 in the off-peak direction. It uses a moveable barrier, is deployed Monday through Friday and has been in operation for 10 years.
New York's Tappan Zee Bridge reverses a lane twice a day, changing the center lane from northbound to southbound and back again. This application also uses Moveable Barrier Technology (See section 8.2.6.6).
Reference 15 identifies the following considerations that need to be addressed when considering a Moveable Barrier technology (MBT) application (which are also applicable to any reversible lane / contraflow lane scenario:
- If reversing a traffic lane is considered, the basic requirement is that off-peak traffic can be accommodated in the remaining lanes. If the traffic volume is too high to be accommodated in the remaining lanes and if severe traffic congestion exists in the peak direction, the feasibility of reversing the direction of a lane should still be investigated in conjunction with other measures, such as ramp metering, to reduce traffic in the off-peak direction. Even if some congestion occurs in the off-peak direction as a result of implementing the contraflow lane, it can still be justified if there is a net benefit in the implementation of such a lane. In other words, the benefits derived from the additional lane in the peak direction exceed the disbenefits resulting from one fewer lane in the off-peak direction.
- If a shoulder is converted to a traffic lane in the peak period by using positive separation technologies, enough right-of-way must exist for the safe operation of such a lane.
8.2.5.6 Mainline Metering
Mainline metering controls the mainline traffic entering a freeway section or a limited access bridge or tunnel. While the technique can create congestion on the mainline upstream of the controlled section, it can help maintain uncongested flow on the mainline downstream. While limited applications of mainline metering on controlled access facilities such as bridges and tunnels roads have been found effective, the concept has not yet found application to a typical metropolitan freeway system.
Mainline metering can accomplish the following objectives:
- Deter traffic from using the freeway, particularly in bottleneck areas.
- Smooth traffic flow through a bottleneck.
- Provide more equitable distribution of delay penalties with respect to motorists entering at metered ramps (16).
- Minimize congestion-induced emissions in environmentally sensitive areas (such as tunnels).
Mainline metering can cause queues on the mainline, which may be met by significant community opposition.
Toll facilities often function as mainline meters. The principal example of mainline metering in the U.S. is westbound I-80 at the San Francisco-Oakland Bay Bridge (16). Shown in Figure 8-9, this installation places the mainline meters just downstream of a 22-bay toll plaza. Westbound traffic approaching the San Francisco-Oakland Bay Bridge passes through the toll plaza and is then metered to narrow the 22 lanes of traffic into four lanes as efficiently as possible. HOV lanes allow HOVs to bypass the traffic queues.
Figure 8-9: Mainline Meter on I-80, Oakland, CA (Westbound Direction) D
Mainline metering has also been used on one lane at the westbound entrance to the Holland Tunnel in New York City (17). A before and after study concluded that metering improved traffic volume throughput by approximately 7%.
Another potentially effective use of mainline metering that has not yet been applied is in a construction zone where traffic demand greatly exceeds the capacity available, and some reserve capacity for vehicles entering at downstream ramps needs to be provided (18).
8.2.5.7 Speed Advisories and Control
Variable speed limits (VSL) are intended to allow reasonable and realistic speeds based on time of day, traffic conditions, weather conditions, construction or maintenance activities, and other factors. With the exception of school zones, use of variable speed limits in the United States has been limited, although many transportation agencies have expressed interest in them. Use has probably not been more widespread due to concerns over their legal basis, the level and type of enforcement required, and the lack of information on proven benefits.
Some static speed limits in dynamic environments have low levels of compliance, and speed limits that are responsive to the situation should be more credible and may result in improved compliance. In other situations, the speed limit may be too high for the conditions, and a variable speed limit could provide additional information that may be beneficial to the driver.
Variable speed limits use traffic speed and volume detection, weather information and road surface condition technology to determine appropriate speeds at which drivers should be traveling, given current roadway and traffic conditions (19). These advisory or regulatory speeds are usually displayed on overhead or portable changeable message signs (CMS) (See Figure 8-10). In the U.S., VSL are deployed in Colorado, Minnesota, Nevada, New Jersey, Massachusetts and Washington State. Often they are part of larger incident management, congestion management, weather advisory, or motorist warning systems.
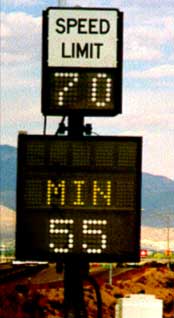
Figure 8-10: Variable Speed Limit Sign
An example deployment is on the New Jersey Turnpike where enforceable variable speed limit signs have been in use since the late 1960s to provide early warning to motorists of slow traffic or hazardous road conditions. Approximately 120 signs are installed over 148 miles of roadway. The posted speed limits are based on average travel speed and are displayed automatically (manual override used for lane closures and construction zones). The posted speed limit can be reduced from the normal speed limit (depending on the milepost location 65 mph, 55 mph, and 50 mph) in five-mph decrements, to 30 mph. The posted speed limit can be reduced for six reasons: accidents; congestion; construction; ice; snow; and fog. The speed warning signs display, "Reduce Speed Ahead" and the reason for the speed reduction. When appropriate, the distance between the warning sign and the beginning of the congestion is displayed on the warning sign. The New Jersey Turnpike Authority feels that the signs are effective, and provide motorists with information on unusual roadway conditions that dictate the need for speed reduction. State Police enforce the reduced speed limits by issuing summonses to those motorists found to be in violation.
VSL systems have been in use for the last 30 years and currently are successfully being deployed and / or tested in Australia and Europe. An example is the Netherlands' Motorway Control System. It provides lane control and speed limit signs generally every 500 meters and is used to slow traffic either in advance of a slowdown / shock wave or work zone. The system has proven effective in reducing collisions by about 16% (20) and has increased throughput 3–5 percent. It also reduces the cost of work zone traffic control.
Tests are being conducted in Maryland, Michigan and Virginia to determine the effectiveness of Variable Speed Limits in work zones. VSL systems will rely on input of vehicle speeds and other information to post an appropriate speed limit, allowing motorists to maintain the most efficient and safe speeds, without endangering themselves, other drivers, or workers. Each of the selected states will implement VSL systems in a work zone, monitor operations, and evaluate system effectiveness.
8.2.5.8 Work Zone Controls
A work zone is an area of a highway with construction, maintenance, or utility work activities; it extends from the first warning sign or rotating / strobe lights on a vehicle to the END ROAD WORK sign or the last temporary traffic control device. Within a work zone, safe traffic flow is maintained by providing temporary signage, channelizing devices, barriers, pavement markings, and / or work vehicles. Traffic management in work zones is important to the safety of both workers and motorists. Time is required to properly develop and implement the traffic control when lanes must be closed to complete the work. No one sequence of traffic control devices can be designed for all situations. In addition, a work zone cannot always maintain the same number of lanes and the path through a work zone will be influenced by the traffic control devices present. Where possible the traffic control plan should be designed to provide the same number of lanes of traffic during construction as before. Ideally, the traffic control plan should be designed for the same free-flow traffic speed that existed before freeway construction.
The MUTCD (2) extensively discusses temporary traffic control plans that include temporary traffic control measures for facilitating travel through a work zone. These plans play a vital role in providing continuity of safe and efficient road user flow through a work zone. Temporary traffic control plans can be very detailed or simply reference typical drawings contained in:
- The MUTCD,
- Standard approved highway agency drawings and manuals, or
- Specific drawings contained in the contract documents.
The degree of detail in the temporary traffic control plan depends entirely on the complexity of the situation. The selected traffic control plan should have the approval of the responsible highway agency prior to implementation.
In addition to the MUTCD, several other resources exist for planning and evaluating work zone strategies. These include:
- FHWA Office of Operations Work Zone Mobility and Safety web site at http://ops.fhwa.dot.gov/wz/index.asp
- The Work Zone Operations Best Practices Guidebook (available from the web site)
- The FHWA Work Zone Mobility and Safety Self Assessment Guide (available from the web site)
The Work Zone Operations Best Practices Guidebook (21) is a resource designed to give state and local transportation agencies, construction contractors, transportation planners, trainers, and others with interest in work zone operations access to information and points of contact about current best practices for achieving work zone mobility and safety. This guide leverages the collection of work zone operations best practices by providing an easily accessible compilation of the best practices in a variety of cross-references, thereby enabling users to find best practices in several different ways, including by:
- State
- Participating organizations (e.g., Federal, State, County, City, Contractor)
- Life cycle (e.g., planning, design, construction)
- Nature of Work (e.g., utility, resurfacing, marking / signage, maintenance, interchange upgrade, bridge repair, bridge maintenance, construction, night work)
- Traffic conditions (e.g., enforcement activities, heavy / normal / light traffic, high posted speeds, large trucks present)
- Setting (e.g., urban, rural)
- Roadway characteristics (e.g., expressways, divided facilities, freeways, freeway ramps, toll roads, arterials)
- Categories:
- Policy and procedures
- Public relations, education, and outreach
- Prediction modeling and impact analysis
- Planning and programming
- Project development and design
- Contracting and bidding procedures
- Specifications and construction materials, methods, and practices
- Traveler and traffic information (project related)
- Enforcement
- ITS and innovation technology
- Education and feedback
The best practices are descriptive not prescriptive. That is, they describe approaches used by transportation agencies, along with contact information. Each organization must determine which of these practices are best suited for its particular situation, considering all factors that affect work zone operations.
The Work Zone Mobility and Safety Self-Assessment Guide (22) is grouped into functional categories that deal with the project development processes, such as Leadership & Policy, Planning & Programming, Design, Construction & Operations, Communications & Training, and Evaluation. The performance-rating scheme is based on the classic process improvement approach. It includes 5 stages – Initiation, Development, Execution, Assessment, and Integration. Within each stage there is a High, Medium, and Low performance level to choose from. The results of this self-assessment can provide an indication of how well transportation agencies are doing in mitigating the impact of work zones on congestion and crashes.
Finally, it is emphasized that the concept of work zone management is more than lane management strategies and the set up / configuration of the work zones themselves (i.e., cost-effective mitigation measures to directly handle the traffic impacts encountered during the construction and maintenance operation). The exposure of the motorist and the highway worker can be reduced – thereby also reducing motorist delays and crash rates – through other proactive means, including:
- Reducing the volume of traffic going through the work zone – The volume of traffic going through the work zone can be reduced by diverting traffic to other routes, detours or modes of transportation, changing driver behavior and trip times during the life of the project, and / or closing the facility during construction.
- Reducing the length of time work zones are in place – The length of time work zones are in place can be reduced by time-based bidding, providing incentives for early completion, putting disincentives in the contract for restricting traffic (lane rental), forcing the contractor to concentrate on shorter sections within the overall project length, partnering, constructability reviews, and / or receiving contractor input on the sequencing of the construction project during the early phases of project design.
- Reducing the frequency that work zones are established to perform construction and maintenance operations – The frequency that work zones are established can be reduced by extending the life of the facility, using the corridor approach, designing for success, and / or an effective preventive maintenance program.
- Providing real-time traveler information to advise motorists of work zone status (current number of lanes closed) and traffic conditions in advance and through the work zone.
- Improving transit service to further reduce traffic volume through the work zone.
8.2.5.9 Toll Facilities
Toll facilities are fully controlled access roadways designed to the same high standards of design as freeways. However, because of both the economic influence they exert on traffic demand for the facility and the traffic metering effect that occurs at the toll collection plazas, toll facilities can also be considered another form of managed lanes. Toll facilities form the most direct user charge for providing revenues based on the costs of travel. Often, they can be implemented more quickly, because the capital funding is available up front and because toll roads often do not have to comply with federal regulations. Also, toll facilities provide a revenue stream for ongoing operations and maintenance.
Legislation has been enacted to facilitate the development of toll facilities through innovative financing. For example, the Federal Highway Act of 1987 provided for eight demonstration projects across the nation, allowing a mixture of toll revenues with state and federal funds on new projects. California enacted legislation that allows the development of joint-power authorities to collect developer fees for transportation projects, and awarded four franchises to private entities, allowing private designing, financing, construction, and operation of toll facilities for 35 years.
Toll road facilities are a means of financing roadway improvements. The intent is to finance roadway construction only if there is sufficient demand willing to pay a premium for services rendered by the facility. Furthermore, the user population must be willing to pay for the opportunity to save time in the system because toll road facilities are generally less congested. The concept of toll roads has proved a realistic procedure to finance the construction of needed facilities. There are several advantages and disadvantages involved in the implementation of toll roads as opposed to free roads. Table 8-4 lists some of the advantages and disadvantages of financing a road via user tolls.
| Advantages | Disadvantages |
|---|---|
|
|
8.2.5.10 Congestion Pricing
Congestion Pricing (also known as Value Pricing) is a lane management strategy whose use has increased significantly due to the public acceptance and use of Electronic Toll Collection (ETC) technologies (See section 8.2.6). Congestion pricing charges a premium to road users who want to drive during peak periods such as rush hour or holiday weekends.
Travel during congestion costs society more (in terms of increased infrastructure needs, increased emissions and fuel consumption); therefore users during those times should pay more. The most straightforward way to implement congestion pricing is on existing toll facilities if they are congested during certain times of day, much like transit or airline fares are often higher during peak travel times.
Key features of congestion pricing for freeway lane management include:
- Facility users carrying ETC transponders
- Tolls varying by time of day based on expected congestion in the corridor
- Discount pricing as an incentive to high occupancy vehicles
- Photo-enforcement of toll violations
Benefits of congestion pricing are:
- Enhanced mobility management of congested facilities
- Short term travel mobility improvement
- Expanded acceptance of ETC for managing transportation facilities
- Increased utilization of HOV or special purpose lanes
- Possible improved public perception of HOV lane use
- Provision of a new management option for the tool kit
- Bridge to long term improvements
Key issues to address when considering congestion pricing include:
- Technology compatibility – among toll collection systems in the region and across the country and across travel modes.
- Enforcement – concerns about legislative changes needed to allow vehicle owners to be ticketed, rather than drivers. Also, verification of occupancy requirements (if implemented) needs to be accommodated without unduly affecting the overall operation of the facility.
- Privacy – concerns about the potential tracking of individuals through the ETC technology. One alternative proposed is the use of Smart cards that maintain their own internal data about the individual's account.
- Price determination – questions have to be resolved as to whether charges should be based on short-term marginal road user costs of an additional vehicle added to the traffic stream, or on long-term costs of providing an equivalent amount of extra capacity to the facility.
There are logistical, institutional, and attitudinal barriers that must be addressed when implementing a congestion pricing system. A feasibility study must therefore be undertaken prior to implementation. The following tasks should be conducted:
- Review of appropriate state-of-the-art technology.
- Attitudinal surveys of the system users.
- Organization of participating agencies and private sector partners.
- Conceptual design for select U.S. cities.
- Preliminary capital and operational and maintenance cost estimates.
- Development of a conceptual implementation plan (i.e., time frame, lead agency, potential funding sources, institutional requirements).
Congestion (roadway) pricing has seen limited use in the United States, though already proven successful in efforts to reduce congestion in Singapore, London, and several Norwegian cities. Implementation of roadway pricing has been discouraged in the U.S. due to technical and political problems. The use of ETC technology overcomes some of the technical barriers such as congestion at toll booths. To overcome political barriers, demonstration projects can be performed to introduce the concept. Congestion pricing should not be introduced on a facility that traditionally has no charge. Two recommended facilities that should be used to introduce this concept are:
- Existing toll facilities, where off-peak discounts and peak-hour surcharges can be introduced to increase ride-sharing incentives and reduce congestion.
- Completely new facilities.
A pricing schedule should be designed so that initial costs are fairly low. These costs should be maintained for a period of 6 to 12 months to permit behavior patterns to stabilize, after which the cost should increase. This process should continue until the cost is at the desired level. The use of congestion pricing is expected to improve the traffic flow, ridesharing, and emission-reduction experienced on the roadway. These improvements should be quantified in the demonstration project to prove these benefits.
Table 8-5 presents barriers to the implementation of congestion pricing using ETC technology, and recommended strategies. Three arguments that justify the use of congestion pricing are:
- Economic argument – automobile users should pay the full cost of the congestion their use of the road imposes on the public.
- Congestion is reduced.
- Environmental improvement – less congestion means less air pollution due to slow moving traffic flows.
One rationale for congestion pricing is that it generates revenue. The facility sells to motorists, on a time-of-day or congestion-level basis, the excess capacity available from operation of HOV or other special purpose freeway lanes or exclusive roadway toll facilities. This concept of High Occupancy Toll (HOT) lanes is discussed in Chapter 9 and Reference 39.
Congestion pricing has gained institutional acceptance as a management tool with the success of toll road and express lane facilities in Southern California. These facilities include:
- In San Diego, California, the FasTrak Facility provides two reversible express lanes in the median of Interstate Highway I-15. This two-lane 8-mile section of separated lanes was restricted to HOV with 2 or more people. This restriction resulted in severely underutilized express lanes while the adjacent unrestricted lanes were typically heavily congested with 30 minutes of delay. By implementing ETC for all vehicles, the SOV could use the excess capacity of the express lanes for a toll. The SOV toll dynamically varies from $0.50 to $4.00 depending on the level of congestion in the express and general purpose lanes. High occupancy vehicles continue to enjoy free use of the express lanes.
- Expanding on the toll road concept in Orange County, California, three toll roads (San Joaquin Hills – SR73, Foothill – SR241, Eastern – SR241/261/133) were built through the issue of bonds backed by future tolls and fees.
- SR-91 Express Lanes (Figure 8-11) is a four lane 10 mile toll road built in the median of California's Riverside Freeway between the Orange / Riverside County line and the Costa Mesa Freeway. The state of the art facility features a fully-automated toll facility, and the first application of value pricing in the U.S. The use of ETC technology eliminated the need to stop and pay tolls at traditional toll booths, thus ensuring the free flow of traffic on the SR-91 express lanes.
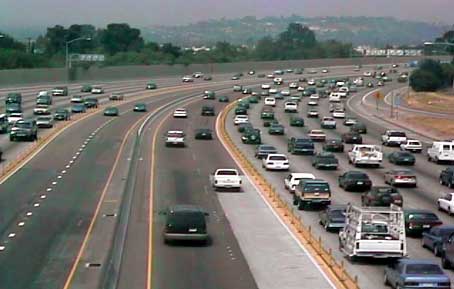
Figure 8-11: SR-91 Express Lanes