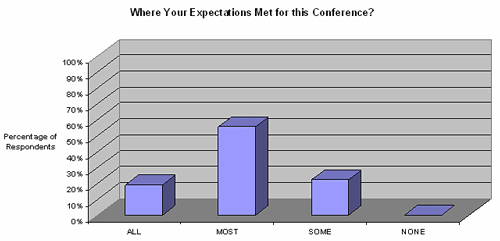
Description of Slide 3. Were Your Expectations Met for This Conference?

This graph shows participants' responses to the question "Were Your Expectations Met for This Conference?" Fifteen percent responded "all," 50 percent responded "most," 18 percent responded "some," and none responded "none."