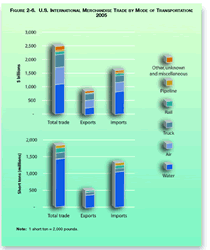
Figures 2-6 and 2-6M. U.S. International Merchandise Trade by Mode of Transportation: 2005
Nearly 80 percent of freight tons in U.S. foreign trade are transported by ship. Although the vast majority of freight tonnage in U.S. foreign trade moves by water, air and truck transportation are nearly as important when freight value is considered. By value, the water share drops to 44 percent, with 25 percent moving by air and 19 percent moving by truck.

Data represented in Figure 2-6 (standard units)
Table in Excel format
| Mode | Total trade Billions of current U.S. dollars |
Exports Billions of current U.S. dollars |
Imports Billions of current U.S. dollars |
|---|---|---|---|
| Water | 1,121 | 262 | 859 |
| Air | 652 | 293 | 359 |
| Truck | 491 | 235 | 256 |
| Rail | 116 | 35 | 81 |
| Pipeline | 52 | 3 | 49 |
| Other, unknown, and miscellaneous | 144 | 77 | 66 |
| Total, all modes | 2,575 | 904 | 1,671 |
| Mode | Total trade Millions of short tons |
Exports Millions of short tons |
Imports Millions of short tons |
|---|---|---|---|
| Water | 1,487 | 390 | 1,097 |
| Air | 7 | 3 | 4 |
| Truck | 191 | 89 | 102 |
| Rail | 141 | 48 | 93 |
| Pipeline | 86 | 5 | 81 |
| Other, unknown, and miscellaneous | 5 | 5 | 0 |
| Total, all modes | 1,917 | 539 | 1,378 |
Note: 1 short ton = 2,000 pounds.
SOURCE: Compiled by U.S. Department of Transportation (USDOT), Research and Innovative Technology Administration (RITA), Bureau of Transportation Statistics (BTS), August 2006. Water and air data—U.S. Department of Commerce, U.S. Census Bureau, Foreign Trade Division, U.S. Exports of Merchandise and U.S. Imports of Merchandise, December 2005. Total, truck, rail, pipeline, other and unknown data—USDOT, RITA, BTS, Transborder Freight Data 2005; and special calculation, August 2006.
Data represented in Figure 2-6M (metric units)
Table in Excel format
| Mode | Total trade Billions of current U.S. dollars |
Exports Billions of current U.S. dollars |
Imports Billions of current U.S. dollars |
|---|---|---|---|
| Water | 1,121 | 262 | 859 |
| Air | 652 | 293 | 359 |
| Truck | 491 | 235 | 256 |
| Rail | 116 | 35 | 81 |
| Pipeline | 52 | 3 | 49 |
| Other, unknown, and miscellaneous | 144 | 77 | 66 |
| Total, all modes | 2,575 | 904 | 1,671 |
| Mode | Total trade Millions of metric tonnes |
Exports Millions of metric tonnes |
Imports Millions of metric tonnes |
|---|---|---|---|
| Water | 1,349 | 354 | 995 |
| Air | 7 | 3 | 4 |
| Truck | 173 | 81 | 92 |
| Rail | 128 | 43 | 85 |
| Pipeline | 78 | 4 | 73 |
| Other, unknown, and miscellaneous | 5 | 5 | 0 |
| Total, all modes | 1,739 | 489 | 1,250 |
Note: 1 short ton = 0.91 metric tonne.
SOURCE: Compiled by U.S. Department of Transportation (USDOT), Research and Innovative Technology Administration (RITA), Bureau of Transportation Statistics (BTS), August 2006. Water and air data—U.S.. Department of Commerce, U.S. Census Bureau, Foreign Trade Division, U.S. Exports of Merchandise and U.S. Imports of Merchandise, December 2005. Total, truck, rail, pipeline, other and unknown data—USDOT, RITA, BTS, Transborder Freight Data 2005; and special calculation, August 2006.
To view Excel files, you can use the Microsoft Excel Viewer.