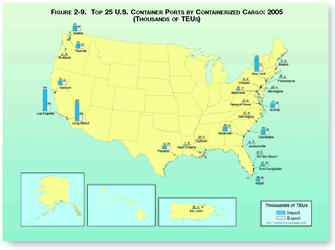
Figure 2-9. Top 25 U.S. Container Ports by Containerized Cargo: 2005 (Thousands of TEUs)
Containerized cargo has grown rapidly over the past few years and is concentrated at a few large water ports. The Port of Los Angeles handles about one-fifth of all the container traffic at water ports in the United States. Together with the Port of Long Beach, this share increases to more than one-third. Container trade at the Ports of Los Angeles and Long Beach doubled between 1995 and 2005, about the same as growth in containerized cargo overall.

Data represented in the figure
Table in Excel format
| Ports | Rank | Export | Import |
|---|---|---|---|
| Los Angeles, CA | 1 | 1,043 | 3,821 |
| Long Beach, CA | 2 | 1,024 | 3,355 |
| New York, NY | 3 | 972 | 2,415 |
| Charleston, SC | 4 | 615 | 894 |
| Savannah, GA | 5 | 670 | 800 |
| Oakland, CA | 6 | 611 | 763 |
| Seattle, WA | 7 | 464 | 875 |
| Norfolk, VA | 8 | 540 | 779 |
| Houston, TX | 9 | 599 | 623 |
| Tacoma, WA | 10 | 362 | 793 |
| Miami, FL | 11 | 324 | 448 |
| Port Everglades, FL | 12 | 302 | 276 |
| Baltimore, MD | 13 | 137 | 244 |
| San Juan, PR | 14 | 48 | 165 |
| Gulfport, MS | 15 | 73 | 109 |
| New Orleans, LA | 16 | 101 | 73 |
| Wilmington, DE | 17 | 41 | 120 |
| West Palm Beach, FL | 18 | 121 | 39 |
| Philadelphia, PA | 19 | 20 | 139 |
| Jacksonville, FL | 20 | 99 | 45 |
| Boston, MA | 21 | 56 | 74 |
| Portland, OR | 22 | 60 | 61 |
| Newport News, VA | 23 | 42 | 61 |
| Wilmington, NC | 24 | 33 | 69 |
| Chester, PA | 25 | 45 | 56 |
Key: TEUs=twenty-foot equivalent units.
Source: U.S.Department of Transportation, Maritime Administration, U.S. Waterborne Container Trade by U.S. Custom Ports, 1997-2005 , based on data provided by Port Import/Export Reporting Service, 2006, available at http://www.marad.dot.gov/MARAD_statistics/index.html as of April 27, 2006.
To view Excel files, you can use the Microsoft Excel Viewer.