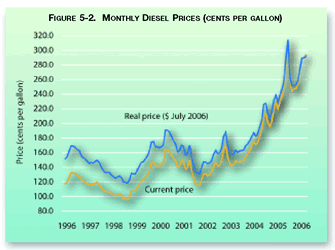
Figure 5-2. Monthly Diesel Prices (cents per gallon)
Diesel prices were about 93 percent higher in July 2006 than 10 years earlier (in inflation-adjusted terms). Over that period prices bottomed out in February 1999 at $1.18 a gallon (in $ July 2006).

Data represented in the figure
Table in Excel format
| Date | Current Price | Real Price(July 2006 dollars) |
|---|---|---|
| Jul-1996 | 117.6 | 151.6 |
| Aug-1996 | 120.1 | 154.6 |
| Sep-1996 | 126.5 | 162.3 |
| Oct-1996 | 132.3 | 168.2 |
| Nov-1996 | 132.3 | 168.9 |
| Dec-1996 | 130.9 | 167.1 |
| Jan-1997 | 129.1 | 164.3 |
| Feb-1997 | 128.0 | 162.4 |
| Mar-1997 | 122.9 | 155.6 |
| Apr-1997 | 121.2 | 153.2 |
| May-1997 | 119.6 | 151.2 |
| Jun-1997 | 117.3 | 148.2 |
| Jul-1997 | 115.1 | 145.2 |
| Aug-1997 | 116.5 | 146.7 |
| Sep-1997 | 116.0 | 145.7 |
| Oct-1997 | 118.3 | 148.2 |
| Nov-1997 | 119.2 | 149.4 |
| Dec-1997 | 116.6 | 146.4 |
| Jan-1998 | 112.0 | 140.3 |
| Feb-1998 | 108.4 | 135.6 |
| Mar-1998 | 106.3 | 132.7 |
| Apr-1998 | 106.7 | 132.9 |
| May-1998 | 106.9 | 133.0 |
| Jun-1998 | 104.1 | 129.3 |
| Jul-1998 | 102.9 | 127.6 |
| Aug-1998 | 100.7 | 124,8 |
| Sep-1998 | 102.4 | 126.8 |
| Oct-1998 | 103.9 | 128.2 |
| Nov-1998 | 102.2 | 126.2 |
| Dec-1998 | 97.3 | 120.2 |
| Jan-1999 | 96.7 | 119.1 |
| Feb-1999 | 95.9 | 118.1 |
| Mar-1999 | 99.7 | 122.3 |
| Apr-1999 | 107.9 | 131.5 |
| May-1999 | 107.3 | 130.8 |
| Jun-1999 | 107.4 | 130.9 |
| Jul-1999 | 112.2 | 136.2 |
| Aug-1999 | 117.2 | 142.0 |
| Sep-1999 | 121.5 | 146.5 |
| Oct-1999 | 122.8 | 147.8 |
| Nov-1999 | 126.3 | 152.0 |
| Dec-1999 | 129.2 | 155.4 |
| Jan-2000 | 135.6 | 162.7 |
| Feb-2000 | 146.1 | 174.2 |
| Mar-2000 | 147.9 | 174.9 |
| Apr-2000 | 142.2 | 168.1 |
| May-2000 | 142.0 | 167.6 |
| Jun-2000 | 142.1 | 166.9 |
| Jul-2000 | 143.4 | 168.0 |
| Aug-2000 | 146.6 | 171.8 |
| Sep-2000 | 163.7 | 190.8 |
| Oct-2000 | 163.7 | 190.5 |
| Nov-2000 | 162.1 | 188.6 |
| Dec-2000 | 156.5 | 182.1 |
| Jan-2001 | 152.4 | 176.2 |
| Feb-2001 | 149.2 | 171.9 |
| Mar-2001 | 139.9 | 160.8 |
| Apr-2001 | 142.2 | 162.8 |
| May-2001 | 149.6 | 170.5 |
| Jun-2001 | 148.2 | 168.6 |
| Jul-2001 | 137.5 | 156.8 |
| Aug-2001 | 139.0 | 158.5 |
| Sep-2001 | 149.5 | 169.8 |
| Oct-2001 | 134.8 | 153.7 |
| Nov-2001 | 125.9 | 143.7 |
| Dec-2001 | 116.7 | 133.7 |
| Jan-2002 | 115.3 | 131.8 |
| Feb-2002 | 115.2 | 131.2 |
| Mar-2002 | 123.0 | 139.3 |
| Apr-2002 | 130.9 | 147.4 |
| May-2002 | 130.5 | 147.0 |
| Jun-2002 | 128.6 | 144.7 |
| Jul-2002 | 129.9 | 146.1 |
| Aug-2002 | 132.8 | 148.8 |
| Sep-2002 | 141.1 | 157.8 |
| Oct-2002 | 146.2 | 163.2 |
| Nov-2002 | 142.0 | 158.6 |
| Dec-2002 | 142.9 | 159.9 |
| Jan-2003 | 148.8 | 165.8 |
| Feb-2003 | 165.4 | 183.0 |
| Mar-2003 | 170.8 | 187.8 |
| Apr-2003 | 153.3 | 168.8 |
| May-2003 | 145.1 | 160.2 |
| Jun-2003 | 142.4 | 157.0 |
| Jul-2003 | 143.5 | 158.0 |
| Aug-2003 | 148.7 | 163.1 |
| Sep-2003 | 146.7 | 160.4 |
| Oct-2003 | 148.1 | 162.1 |
| Nov-2003 | 148.2 | 162.7 |
| Dec-2003 | 149.0 | 163.7 |
| Jan-2004 | 155.1 | 169.6 |
| Feb-2004 | 158.2 | 172.0 |
| Mar-2004 | 162.9 | 176.1 |
| Apr-2004 | 169.2 | 182.3 |
| May-2004 | 174.6 | 187.0 |
| Jun-2004 | 171.1 | 182.7 |
| Jul-2004 | 173.9 | 185.9 |
| Aug-2004 | 183.3 | 195.9 |
| Sep-2004 | 191.7 | 204.4 |
| Oct-2004 | 213.4 | 226.4 |
| Nov-2004 | 214.7 | 227.6 |
| Dec-2004 | 200.9 | 213.8 |
| Jan-2005 | 195.9 | 208.0 |
| Feb-2005 | 202.7 | 214.0 |
| Mar-2005 | 221.4 | 231.9 |
| Apr-2005 | 229.2 | 238.5 |
| May-2005 | 219.9 | 229.0 |
| Jun-2005 | 229.0 | 238.4 |
| Jul-2005 | 237.3 | 245.9 |
| Aug-2005 | 250.0 | 257.8 |
| Sep-2005 | 281.9 | 287.1 |
| Oct-2005 | 309.5 | 314.6 |
| Nov-2005 | 257.3 | 263.7 |
| Dec-2005 | 244.3 | 251.4 |
| Jan-2006 | 246.7 | 252.0 |
| Feb-2006 | 247.5 | 252.3 |
| Mar-2006 | 255.9 | 259.3 |
| Apr-2006 | 272.8 | 274.2 |
| May-2006 | 289.7 | 289.7 |
| Jun-2006 | 289.8 | 289.2 |
| Jul-2006 | 293.4 | 291.9 |
Sources: Diesel price: U.S. Department of Energy, Energy Information Agency, U.S. Petroleum Prices, available at www.eia.doe.gov as of September 5, 2006.
Consumer price index: U.S. Department of Labor, Bureau of Labor Statistics, Consumer Price Index – All Urban Consumers, Monthly, available at www.bls.gov as of September 5, 2006.
To view Excel files, you can use the Microsoft Excel Viewer.