Economics: Pricing, Demand, and Economic Efficiency—A Primer
Pricing and Economic Efficiency
Congestion Externalities and Economic Efficiency
Economics is focused on the allocation of scarce resources in the economy. When resources are allocated to their highest valued use in the economy, the outcome is said to be economically efficient. Under most circumstances, the setting of prices in markets through the interaction of consumers and producers can help achieve an efficient outcome. In many other cases, however, market forces can lead to excessive consumption in a particular sector; highways are a good example of this.
The key to achieving economic efficiency in a market is ensuring that prices reflect the opportunity cost to society of producing and consuming a particular good or service. For most goods and services, this opportunity cost will be equivalent to the incremental cost of the resources that are required to produce the good. For some goods, however, one person’s consumption can have a negative impact on other users (or non-users) of the good, a situation that economists refer to as an external cost or negative externality. If the market price does not reflect these external effects, then the opportunity cost to society will be greater than the price that consumers face, leading to excess consumption from the point of view of society and thus creating economic inefficiency.
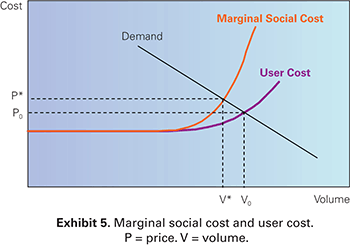
From an economic point of view, externalities are a key problem of congested highways. To see why, consider the generalized cost curve shown in Exhibit 3. This curve is an average cost curve and reflects the rise in travel costs that individual users face as traffic volumes increase. What it does not reflect, however, are the incremental costs that each successive vehicle that enters the traffic stream imposes on all the others by causing the speed of the entire flow of vehicles to decrease as congestion builds. The true opportunity cost to society of using highways thus includes both the costs that individual users face and the congestion externality. This is sometimes referred to as the marginal social cost of congestion (see Exhibit 5).

Graph. Exhibit 5: Marginal social cost and user cost. This graph shows the true opportunity cost of using highways, which includes the costs that users face and congestion externality, sometimes referred to as marginal cost. User cost is represented by a solid line that begins one-third of the way up the y-axis (cost) and moves straight in a horizontal line from left to right before beginning to curve upward two-thirds of the way across the x-axis (volume). A straight solid line represents demand. It moves downward across the graph, from high on the y-axis (cost) to high on the x-axis (volume). A third solid line represents marginal social cost, which initially follows the user cost line, but begins curving upward earlier than the user cost line to intersect with demand. The graph also has two dotted lines (one that moves horizontally from the y-axis, P0, and one that moves vertically from the x-axis, V0) that meet at the point where the first solid line (user cost) and the second solid line (demand) intersect. This represents the equilibrium point at which supply and demand are in balance. Two additional dotted lines (P* and V*, beginning slightly higher on the y-axis and slightly lower on the x-axis compared with P0 and V0, respectively) meet on the demand line where marginal social cost intersects demand, which represents where the efficient traffic level would occur according to society’s viewpoint.
From the point of view of society, the efficient traffic level would occur at the point where the marginal social cost curve meets the demand curve, shown in Exhibit 5 as V*. At this traffic level, all the users of the highway value their trips at least as much as the incremental cost to society of adding more users. The equilibrium traffic level, however, is somewhat higher, at V0. At this point, there are a large number of drivers who are using the facility, because the value they place on travel is greater than the cost that they face (the demand curve is above the average user-cost curve), but the cost to society is greater than the value they receive. Thus, there is an economic efficiency loss due to excessive traffic volumes.
Efficient Pricing
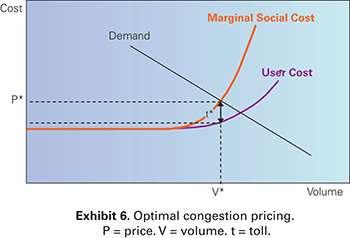
Improving economic efficiency under these circumstances requires the elimination of trips that are valued less than their social cost. One way to do this might be to somehow identify all of the lower valued trips and to ensure that they do not occur during this demand period on that particular facility, perhaps through prohibition. A much simpler means, however, is to adjust the price signals that potential users of the highway facility receive. This can be done by imposing a toll on all users of the facility during congested periods corresponding to the magnitude of the congestion externality; thus, the price that users face is equivalent to the marginal cost to society. At the optimum toll level (t* in Exhibit 6), lower valued trips will be shifted to other routes or time periods (or not made at all), such that the new equilibrium traffic volume is also the socially optimum level. This is congestion pricing.

Graph. Exhibit 6: Optimal congestion pricing. This graph shows that at the optimum toll level (t* in the graph), lower valued trips will be shifted to other routes or time periods or not made at all. User cost is represented by a solid line that begins one-third of the way up the y-axis (cost) and moves straight in a horizontal line from left to right before beginning to curve upward two-thirds of the way across the x-axis (volume). A straight solid line represents demand. It moves downward across the graph, from high on the y-axis (cost) to high on the x-axis (volume). A third solid line represents marginal social cost, which initially follows the user cost line, but begins curving upward earlier than the user cost line to intersect with demand. Two dotted lines run from the y-axis (cost) and meet with a third dotted line (V*), which runs vertically from the x-axis (volume) until it hits the demand line. The first dotted line (P*) runs from the y-axis in a straight line until it meets V* where marginal social cost intersects with demand. The second dotted line runs from the y-axis in a straight line until it meets V*, where V* intersects with user cost. The space between marginal social cost and user cost along V* is labeled, t*, the optimum toll level.
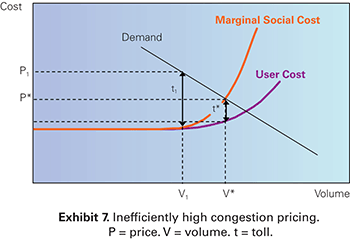
There are several important points to note with regard to efficient pricing. The first is to emphasize that the optimal congestion toll is intended to reduce congestion on the facility but not eliminate it. To see why, consider Exhibit 7. Eliminating congestion in this example would require much more significant reductions in traffic volumes to V1, just before congestion begins to build. Doing so with pricing would require a toll of t1, much greater than the “optimal” toll of t*. This would yield an inefficiently low level of traffic on this facility, because many users would be priced based on those who value their travel more than it costs society, even when accounting for the external costs that they impose on others.

Graph. Exhibit 7: Inefficiently high congestion pricing. User cost is represented by a solid line that begins one-third of the way up the y-axis (cost) and moves straight in a horizontal line from left to right before beginning to curve upward two-thirds of the way across the x-axis (volume). A straight solid line represents demand. It moves downward across the graph, from high on the y-axis (cost) to high on the x-axis (volume). A third solid line represents marginal social cost, which initially follows the user cost line, but begins curving upward earlier than the user cost line to intersect with demand. Two dotted lines run from the y-axis (cost) and meet with a third dotted line (V*), which runs vertically from the x-axis (volume) until it hits the demand line. The first dotted line (P*) runs from the y-axis in a straight line until it meets V* where marginal social cost intersects with demand. The second dotted line runs from the y-axis in a straight line until it meets V*, where V* intersects with user cost. The space between marginal social cost and user cost along V* is labeled, t*, the optimum toll level. A second set of dotted lines is displayed in the graph. P1 runs above P* on the y-axis until it meets V1, which runs vertically from the x-axis, at the demand line. The space along V1 from when it is intersected by the first dotted line to when it is met by P1 on the demand line is labeled t1, a toll much greater than the optimal toll of t* that would yield an inefficiently low level of traffic.
The second point is to note that revenue generation is not the primary purpose of congestion pricing, which is intended to better align supply and demand to overcome the economic inefficiencies imposed by congestion. In reality, of course, any such tolling scheme could potentially generate significant revenues, whose use becomes a significant policy and operational issue. The relationship of congestion pricing to user revenues and infrastructure investment will be discussed in a separate volume in this primer series.
For a given facility, the level of the optimal congestion toll and the resulting effect on congestion levels is largely a function of the elasticity of demand for travel. If demand is relatively inelastic, the optimal congestion toll will be high, and the effect on reducing congestion will be relatively low. Conversely, if demand is more elastic, then a greater reduction in traffic volumes and congestion can be achieved with a smaller toll. As was discussed above, a key factor in determining the elasticity of demand is the quality and availability of alternatives to highway use in peak periods, such as transit or teleworking. The implication of this is that measures to improve such alternatives can greatly improve the effectiveness of efficient pricing in reducing congestion.
Variability in Demand and Pricing
The level of the congestion toll is also a function of the level of demand. Although this is intuitively obvious, it has important implications for the design of congestion-pricing schemes and helps demonstrate its superiority to other forms of user charges. As was noted above, one of the key features of the demand for highways is that it varies significantly by time of day as well as by location. This implies that the optimal congestion tolls will vary over the course of the day on the basis of fluctuations in demand. Suppose, however, that a “flat” toll (e.g., fixed tolls and fuel taxes that do not discriminate based on when travel occurs) must be charged that does not vary in this manner. In theory, the flat toll could still be set to match the optimal toll during congested, high-demand periods. However, if the same toll rate applies during uncongested, low-demand times (when there are no congestion externalities and thus no optimal toll), traffic volumes will be inefficiently low in those periods. In fact, because the tolls are the same throughout the day, some of that traffic might even move back into the congested period. Because of the potential for this to occur, the optimal toll during the peak period would be lower (and less effective at reducing congestion) if the tolls cannot vary by time of day.
This example can be extended to multiple demand periods. Suppose the congestion toll is structured to be charged at a fixed rate when it is collected but may be zero (i.e., not collected) during off-peak periods. To the extent that demand varies during the congestion period (such as between the height of rush hour and “shoulder hours” adjacent to the peak), the same considerations would apply. Congestion tolls for the shoulder period would either be inefficiently high or inefficiently low. The result is that the more variability there is in the congestion-pricing scheme, the more effective it can be at reducing congestion and the closer it can come to achieving an economically efficient outcome.
Similar considerations apply when looking at pricing across facilities in different locations. Although traffic congestion can be quite severe in large urban areas, there is much less congestion in smaller cities or rural areas. As a result, a user charge (such as fuel taxes) that is applied uniformly to both congested and uncongested areas will not be nearly as effective as congestion-based pricing in efficiently allocating resources within the economy.
Another consideration in limited congestion pricing concerns alternate routes. Suppose there are two parallel roads between the same origin and destination, both subject to congestion, but only one of them can be priced. If congestion tolls are only charged on the one facility, some of the trips that are priced off that facility will shift to the unpriced facility, exacerbating congestion there. Given the possibility of this to occur, the optimal toll under such a situation will be lower, as will the impact on reducing congestion levels. An important implication of this is that congestion pricing will be much more effective if it is jointly applied to all major highway facilities in a congested corridor, rather than to only a subset of the alternative routes.
In reality, of course, highway networks are comprised of a whole series of interconnected segments, supporting both alternative and connecting routes, as well as access to connections with other modes (such as train stations). The Federal Highway Administration's (FHWA's) Office of Operations has been conducting research to examine the potential impact of congestion pricing when applied to such real-world transportation networks.
Congestion Pricing and Other Externalities
Highway travel creates other external costs for society, in addition to congestion. Perhaps the most significant of these other impacts is the damage caused to the environment and human health by highway vehicle emissions. In a broad sense, the marginal social cost of highway use would include these costs. Market and regulatory strategies for dealing with environmental externalities also exist, such as taxes on fuel or regulations on vehicle-emissions control systems and fuel content, and such strategies are the most effective way of dealing with these particular externalities. However, to the extent that current mechanisms do not fully capture these environmental externalties, congestion pricing can help reduce their magnitude by reducing excessive highway use (at least during congested travel periods).
Toll-Collection Costs and the Role of Technology
The preceding discussion of the economic principles underlying congestion pricing does not address the cost of actually collecting such tolls from users. Indeed, although William Vickrey articulated the basic theory of congestion pricing in his Nobel Prize-winning work in the 1950s, its potential for widespread application was limited by the available methods of collecting tolls. With manned tollbooths and the traffic-flow restrictions that they impose on roadways, it was a case of the “cure being worse than the disease.”
Advancements in tolling technology over the past two decades, however, have made variable tolling in urban cores and on limited-access highways a viable option, and future developments in global-positioning satellite (GPS) and dedicated short-range communications technologies may make it feasible to adopt congestion pricing on an even wider basis. Two other volumes in this primer series, Technologies That Enable Congestion Pricing and Technologies That Complement Congestion Pricing, describe these technologies in greater detail.