
More and more, transportation system operators are seeing the benefits of strengthening links between planning and operations. A critical element in improving transportation decision-making and the effectiveness of transportation systems related to operations and planning is through the use of analysis tools and methods. This brochure is one in a series of five intended to improve the way existing analysis tools are used to advance operational strategies in the planning process. The specific objective of developing this informational brochure series was to provide reference and resource materials that will help planners and operations professionals to use existing transportation planning and operations analysis tools and methods in a more systematic way to better analyze, evaluate, and report the benefits of needed investments in transportation operations.
The series of brochures includes an overview brochure and four case studies that provide practitioners with information on the feasibility of these practices and guidance on how they might implement similar processes in their own regions. The particular case studies were developed to illuminate how existing tools for operations could be utilized in innovative ways or combined with the capabilities of other tools to support operations planning. The types of tools considered when selecting the case studies included:
Additional information on these existing tool types is presented in the overview brochure to this series.
In selecting the case studies to highlight in this brochure series, a number of innovative analysis practices and tool applications were considered. Ultimately, four different case studies were selected from among many worthy candidates. Each of these case studies represents an innovative use of one or more of the tool types listed above. Figure 1 presents the topics of the case studies and maps them to the related tool. Although individual case studies were not developed for each tool category, this should not be considered as a measure of indictment of the ability of any tool type to be used in innovative ways to support operations planning – there simply weren’t project resources to identify and document all the innovative practices being used. Likewise, the selection of a particular case study representing a specific tool should not be construed as the only manner in which to apply the particular tool. Instead, the case studies represent a sampling of the many innovative ways planners and operations personnel are applying these tools currently.
Figure 1. Analytical Methods/Tools and Related Case Studies Developed Under this Project
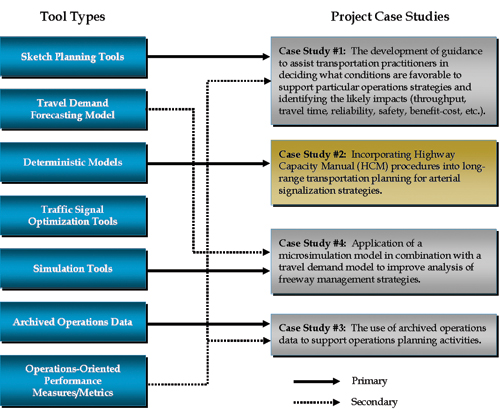 Figure 1 - flow chart - The figure shows that the four case studies represent a variety of the traffic analysis tool types. Each case study supports a primary tool type and several also support multiple case studies. Case study number two is highlighted to represent the contents of this document and it primarily supports the deterministic models tool type.
Many mid- and long-range transportation planning efforts make use of regional transportation planning models to forecast future traffic volumes on roadways. The traditional four-step process is used to generate trips at origins, to distribute trips to destinations, to choose the mode used for each trip, and to assign trips along various alternative routes between origin and destination. This last step of the process, trip assignment, is the focus of this case study.
An iterative process is typically used for trip assignment, where all trips between an origin and destination are assigned to the shortest-time path under free-flow conditions. If too many trips are assigned to a given link in a network, congestion results, which results in a longer travel time. The new travel time is used as an input to the next model run and a number of similar iterations are run as the model tries to balance travel times along the various alternative routes.
The estimate of speed (and from speed, travel time) for a given network link is typically based on a function that relates speed to the link’s volume-to-capacity ratio. The link capacity is usually related to the number of directional lanes on the link and the roadway’s functional class, and a relatively small set of assumed capacities are built into the model. During the model calibration process, these capacities may be manually adjusted up or down in an effort to more closely match modeled traffic demands to existing conditions. However, it would be desirable to be able to more accurately specify roadway capacities within the model to begin with.
The roadway functional class is a surrogate for many of the operational factors that impact capacity. One of the most important of these factors for arterials is the amount of green time allocated to through movements at the signalized intersection at the end of the link. To better estimate link capacity, this case study developed an automated methodology to 1) transfer demand volumes from a regional model to software implementing the Highway Capacity Manual’s (HCM) Urban Streets procedure, 2) combine the volumes with known traffic signal timings to calculate a link-specific capacity, and 3) transfer that capacity back to the regional model for the next iteration. In addition, operational treatments that can influence capacity can be accounted for in the HCM-implementing software, thus allowing the effects of these treatments to be reflected in the regional model output.
The participating agency for this case study was the Wasatch Front Regional Council (WFRC), which is the metropolitan planning organization (MPO) for Davis, Morgan, Salt Lake, Tooele, and Weber Counties in Utah (i.e., the Salt Lake City–Ogden region). At the time of the case study, WFRC was in the process of updating its regional transportation plan. The agency’s travel demand model includes major urban roadways within the WFRC region, as well as major urban roadways in Utah County (Provo) to the south.
Prior to the start of the case study, WFRC staff had developed a prototype spreadsheet implementing the HCM’s Urban Streets methodology. To make the case study results more transferable to others, it was decided at the start of the case study to use the ARTPLAN software developed by the Florida DOT (FDOT) for capacity analysis, rather than the WFRC spreadsheet. This decision was made for several reasons, but primarily because:
Other HCM-implementing software is available on the market that may also be suitable for the type of work described in this case study; however, ARTPLAN is used in this document to illustrate the process, as potential users can readily obtain the software.
WFRC exported a table from their model that described the characteristics of the roadway network’s links. The following link attributes are required:
In addition, as discussed later, an attribute defining the segment’s position within a given corridor may be needed.
WFRC also provided a database of current intersection traffic signal locations that allowed the traffic signal data (cycle length, minimum arterial through-traffic green time, and control type) to be matched to a specific node (intersection). In addition, a database was provided that allowed the names of intersecting roadways to be matched to a specific node/intersection. Compiling such a database could take some time, depending on the number of agencies that operate traffic signals within a region, and whether the timing data comes from paper timing plans or is available electronically. The database would need to be updated periodically to reflect signal timing changes.
The following are also inputs to the HCM Urban Streets procedure. These values were set to default values because the required data were either not available from the regional model or because the model’s data were not reliable enough at the link level:
Users are able to override default values on specific links within ARTPLAN (or other HCM-implementing software). However, a reasonable value needs to be provided as an initial input to the software. Other regions would use default values appropriate to conditions within their region.
Finally, ARTPLAN requires a few additional default values beyond the usual HCM defaults, either because FDOT has extended the HCM2000 procedure (e.g., impacts of medians on urban street capacity) or because certain inputs are needed for a successful file import to ARTPLAN even if the values are not needed for a particular analysis. These additional default values consist of the following:
The files output by the regional model were not in the same format used by input files for ARTPLAN. Therefore, it was necessary to convert WFRC’s model data into the required format. ARTPLAN uses the Traffic Model Markup Language (TMML) format, which is an Extensible Markup Language (XML) description of data commonly used by traffic analysis software. TMML can be used to transfer data between software programs that support the XML format.
For this case study, both the data exported from the WFRC model and the traffic signal data were imported into a Microsoft Access database as separate tables. In the case study, only a single arterial street corridor was studied; a full-blown application could conceivably study the entire network. Additional tables were set up within the database to generate the default values not available from the WFRC data. Queries were written in Microsoft Access to join the data from the model and default tables and convert them into the proper format for ARTPLAN. Finally, a user interface (the “Data Conversion Switchboard”) was developed to help automate the process.
Users in other regions would need to perform the following tasks to convert their data:
 screenshot - The figure shows the Switchboard interface’s seven options: modify input parameters, view available corridor sections, specify corridor for analysis, export XML data, import XML data, develop corridor capacity results, and append new data to corridor capacity results.
The initial database setup covered by the first task in this process takes some time and requires careful attention, as any mistake made in specifying fields will result in an output file that cannot be read by ARTPLAN. Detailed information on the process is provided at the end of this document.
Once the input file has been created, it can be opened within ARTPLAN, which will then calculate the capacities for individual segments. If a user desired, ARTPLAN could be used at this stage to test the capacity impacts of access management strategies (e.g., installing a raised median), physical improvements (e.g., exclusive turn lanes at intersections), or operational strategies (e.g., improvements to the traffic signal progression). Once any desired changes were made, the user would then save the file, which would now be updated with each link’s capacity.
There are two current limitations of the ARTPLAN software that analysts should be aware of. First, ARTPLAN limits input files to include a maximum of nine links. Thus, if capacities were desired for a longer corridor or for an entire region, the import-calculate-export process would need to be repeated multiple times. Second, ARTPLAN tests input values for reasonableness, so that reported performance measures will also be reasonable. While this is an understandable constraint to avoid reporting unrealistic speed estimates and levels of service, capacity estimates are independent of the demand volume, for a given average green time for the through movement at a traffic signal. Regional models, particularly during the iteration process, can produce traffic demand volumes that greatly exceed what a street segment could realistically carry. If the demand volume input for a link exceeds ARTPLAN’s built-in threshold (>5,000 vehicles per hour), no capacity will be calculated, even though the capacity calculation would still be valid. A workaround for this issue would be to set the input volume to zero for each link (if only capacities are desired as an output), or to reduce very high input volumes to 5,000 vehicles per hour, if other performance measure outputs are desired from ARTPLAN to supplement the capacity estimate.
It should be noted that if some other operations software besides ARTPLAN had been used for the case study, it is likely that different, but just as potentially significant, issues would have arisen in developing a data conversion tool for that software.
The final step in the process is transferring the capacity results back to the regional model. The Switchboard can be used to import the ARTPLAN file back into Microsoft Access, extract the capacity results and match them back to the correct model link, and (if more than nine links are being evaluated) append the results to a master results file. The more-realistic capacities would then be available to the regional model to use.
One software limitation to be aware of is that ARTPLAN does not currently save a unique ID number for a given link. Therefore, the Switchboard matches capacities back to links using the link length field. If two links have an identical length, the wrong capacity may be matched to one of the links. A workaround for this issue is to add a small unique number to the link length (for example, the link ID number divided by 100,000, if lengths are calculated in miles).
This case study showed, at a proof-of-concept level, that it is possible to export data from a regional model to HCM-implementing software, calculate link-specific capacities based on a link’s characteristics (particularly traffic signal timing), and import those capacities back into the regional model. There are two main benefits from doing so:
The table below compares the default arterial capacity to ARTPLAN’s estimated capacity for the portion of State Street analyzed in the case study. The table also shows the revised capacity that would be obtained with a five-mph higher speed limit and additional green time allocated to the corridor (at the expense of side-street movements). The table shows the WFRC model’s default capacities overestimated the street’s actual present-day capacity by up to 18 percent and illustrates the maximum degree to which capacity could potentially be improved without adding another through lane.
Segment |
WFRC Default Capacity |
ARTPLAN Capacity |
ARTPLAN Revised Capacity |
|---|---|---|---|
First Avenue to Second Avenue |
658 |
560 |
780 |
Second Avenue to South Temple |
1,722 |
1,690 |
2,330 |
South Temple to 100 South |
1,722 |
1,690 |
2,330 |
100 South to 200 South |
1,722 |
1,690 |
2,330 |
200 South to 300 South |
1,722 |
1,690 |
2,330 |
300 South to 400 South |
1,722 |
1,690 |
2,330 |
A key ingredient to this process is obtaining traffic signal data. Depending on the number of traffic signals in the region, the number of different agencies owning traffic signals, and the format in which traffic signal timing plans are kept (electronic versus paper), assembling the traffic signal database could be a significant effort. The database would also need to be updated periodically. Trying out this process first on a selected corridor in a region, rather than trying to apply it to the entire region would allow a planning agency to realistically evaluate the amount of work required.
Matching the regional model’s data fields to those used by ARTPLAN would be a one-time preparatory step that an agency would need to undertake; however, this is a straightforward process following the steps in this case study’s appendix. One of the case study’s data-gathering challenges was cleaning the data set of inconsistent street names. Over the years, as the WFRC travel model network evolved, inconsistencies in street names were introduced. For example, one facility in the network is identified variously as “1900 West,” “1900 W,” “Main St,” “State St,” and “SR 126,” all of which are appropriate names for the facility, but which make it nearly impossible to select these segments by corridor using computer tools. WFRC staff invested time creating a more consistent street name field that proved very useful when exporting the data to ARTPLAN. However, this street name update is only good until the next time that network revisions are made. Using GIS overlays could facilitate the task of keeping street names consistent, provided the GIS layer is accurate.
If arterial link volumes are anticipated to exceed 5,000 vehicles per hour, the input volumes will need to be set to zero (or some nominal value) in order for ARTPLAN to calculate link capacities. If other performance measure outputs, such as average travel speed or level of service, are desired from ARTPLAN, volumes greater than 5,000 vehicles per hour will need to be reduced to 5,000 vehicles per hour or less. As these volumes would still be significantly higher than an urban street’s capacity, the other performance measures should still indicate poor performance, even with a lower demand volume.
ARTPLAN is currently only capable of analyzing nine links at a time. This limitation means that developing capacities for an entire network would require significant labor time to set up each nine-link analysis run and then compile the results together. More feasible at this point in time would be to analyze an arterial street corridor. As many corridors are longer than nine links, the import-calculate-export process would still probably need to be run several times and the results compiled to get results for the full corridor. If other output values besides capacity are required (e.g., speed or level of service), an additional necessary step would be to supply a field that indicates the sequencing of links along the corridor.
This appendix provides an overview of the Microsoft Access tables and queries and provides step-by-step guidance on using the switchboard.
The Microsoft Access database consists of a set of default tables, a planning model data table (WFRC’s long-range transportation model data in this case), and queries that modify the model data into the format used by ARTPLAN.
The following screen capture shows the tables contained in the database.
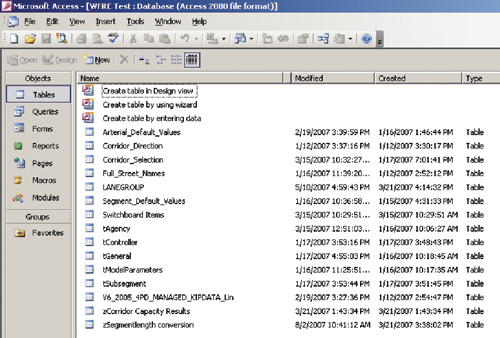 screenshot - The Microsoft Access screenshot shows the various data tables contained in the database including: arterial default values, corridor direction, corridor selection, full street names, lane group, segment default values, switchboard items, “tAgency,” “tController,” “tGeneral,” “tModelParameters,” “tSubsegment,” managed KIP data, corridor capacity results, and segment length conversion.
The following tables contain the default values that ARTPLAN requires for a successful file import. Some of these values are used as inputs to ARTPLAN’s operations analyses, while others are placeholders for the results of the analysis. Any of the default values contained in these tables can be user-adjusted within ARTPLAN for a specific link. If a default value applies to an entire corridor or network, it is easiest to supply it via these tables. Users should make sure that any values they supply conform to ARTPLAN’s acceptable ranges of values for a particular variable; otherwise, the XML file will not successfully import into ARTPLAN. The allowed ranges of values are provided within the ARTPLAN user’s manual, and the on-screen help for ARTPLAN, as well as at the bottom of the data entry window within ARTPLAN.
The following tables are used by the ARTPLAN conversion routine, linking capacity results from ARTPLAN back to the Access database:
The following tables in the Microsoft Access template are specific to the WFRC’s model data and would be replaced with equivalent tables from the local model:
The following screen capture shows the queries contained in the Microsoft Access database. These queries either reference a default table or consolidate data from the default tables with the model data.
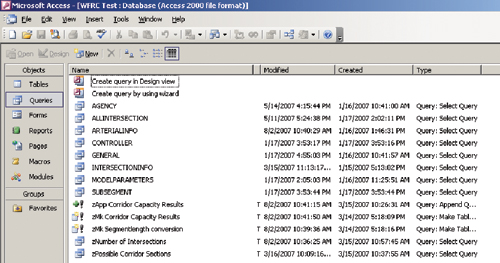 screenshot - The Microsoft Access screenshot shows some the various queries included in the database including: agency, all intersection, arterial info, controller, general, intersection info, model parameters, subsegment, corridor capacity results, segment length conversion, number of intersections, and possible corridor sections.
The following queries join and structure the data from the model and default tables into the format used by ARTPLAN. The queries are exported as XML files that are subsequently consolidated into a single ARTPLAN input file. It is essential that the content and format of these queries not be changed in order for the ARTPLAN conversion routine to run successfully. The queries can be viewed in design view (right click on the query name and select “Design View”) to get a better understanding of how the tables join together, and to view the structure and format of the fields within the query.
The following queries create or populate tables that contain ARTPLAN’s capacity results:
For the “ALLINTERSECTION” query, follow these steps to add the new dataset and to update the table links and data fields:
Apply the same process for the “ARTERIALINFO” query.
The Microsoft Access database, although tailored to the WFRC’s regional model, was developed in such a way that all of the tasks can be performed through the Switchboard interface. The Switchboard, shown below, automatically loads when the Microsoft Access database is opened and can also be accessed through the “Forms” menu in Access.
The following Switchboard options are available:
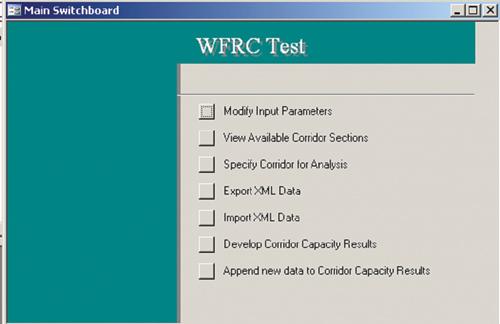 screenshot - The figure shows the Switchboard interface’s seven options: modify input parameters, view available corridor sections, specify corridor for analysis, export XML data, import XML data, develop corridor capacity results, and append new data to corridor capacity results.