2009 Urban Congestion Trends
How Operations is Solving Congestion Problems
PDF Version (3.7MB)
You will n eed the Adobe Reader to view the PDFs on this page.
For More Information: https://ops.fhwa.dot.gov/perf_measurement/index.htm
Contact Information: Operations Feedback at OperationsFeedback@dot.gov.
U.S. Department of Transportation
Federal Highway Administration
Improving Mobility Through Innovative Solutions
Congestion Facts
- All three congestion measures—daily hours of congestion, time penalty for each trip, and worst-trip time penalty—have declined.
- Traffic congestion has declined in almost all monitored regions.
- Less wasted time and fewer hours of the day devoted to stop-and-go traffic were observed in 16 of 23 monitored regions.
- At least one of the three measures improved in 20 of 23 monitored regions.
- Congestion is lowest during the summer vacation season as evidenced by trip times.
Congestion Measures
- Hours of congestion—amount of time when freeways operate below 50 mph.
- Travel Time Index (TTI)—time penalty for a trip on an average day. A TTI of 1.30 indicates a 20-minute free-flow trip takes 26 minutes in the rush hours.
- Planning Time Index (PTI)—time penalty for a trip on the worst day of the month. A PTI of 1.60 indicates a 20-minute free-flow trip takes 32 minutes in the rush hours.
It's a fact: congestion in U.S. cities has declined over the past two years. Whatever the day of the week, whatever the time of day, mobility has improved—almost across the board.
This is partly a result of less traffic on the road. It's worth noting, though, that while the economic downturn began in December 2007, the "traffic recession" began a month or two earlier. And all the congestion measures were still lower at the end of 2009 than in October 2007, despite signs that the economy is beginning to recover.
In recent years, innovative strategies in traffic operations have proven to be a key factor in reducing congestion. Cities are managing traffic smarter and more efficiently—and congestion trends, seen on the facing page, bear out the fruits of that labor.
This document contains a number of success stories detailing how state and local agencies reduced the effects of congestion in their communities. More time with families, less fuel consumption, less emissions polluting the air, and a more productive workforce—these are the dividends resulting from innovative operational investments.
Hours of Congestion Each Day
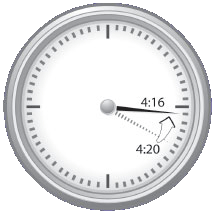
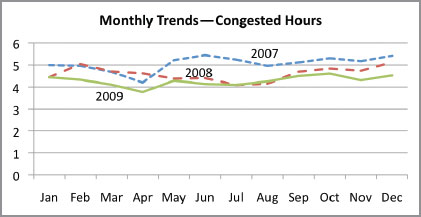 The graph shows monthly trends in congested hours for 2007, 2008 and 2009. All months are between 3.8 and 5.5 hours. April is the lowest month in 2007 and 2009; July and August are the lowest in 2008. June and December are highest in 2007; February and December are highest in 2008 and October is highest in 2009.
Congested time declined 4 minutes from 2008 to 2009, from 4:20 to 4:16.
Only one region had more than a 10-minute increase.
Time Penalty Each Trip
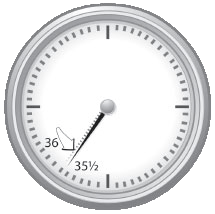
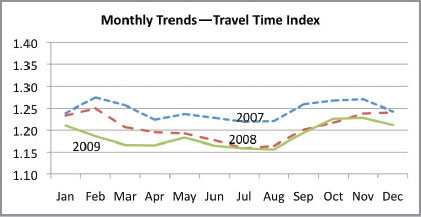 The graph shows monthly trends in Travel Time Index for 2007, 2008 and 2009. All months are between 1.15 and 1.28. Summer months are the lowest and congestion increases in the fall and winter. 2009 values are typically lower than the same months in 2007 and 2008.
The time to make a trip that takes 30 minutes in free-flow conditions declined from 36 minutes in 2008 to 35.5 minutes in 2009.
Worst-Trip Time Penalty
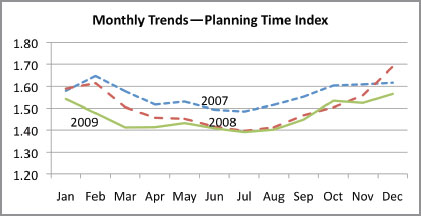 The graph shows monthly trends in Planning Time Index for 2007, 2008 and 2009. All months are between 1.40 and 1.70. Summer months are the lowest and congestion increases in the fall and winter. 2009 values are typically lower than the same months in 2007 and 2008.
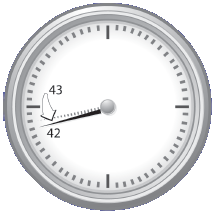
Travel time on the worst day of the month (for a 30-minute trip) declined from 43 minutes in 2008 to 42 minutes in 2009.
The clock hands show the time wasted in 2008 (dashed) and 2009 (solid).
Data from traffic operations centers and public-private partnerships were provided to the Federal Highway Administration from the following regions: Atlanta, GA; Boston, MA; Chicago, IL; Detroit, MI; Houston, TX; Los Angeles, CA; Minneapolis-St. Paul, MN; Oklahoma City, OK; Orange County, CA; Philadelphia, PA; Phoenix, AZ; Pittsburgh, PA; Portland, OR; Providence, RI; Riverside-San Bernardino, CA; Sacramento, CA; St. Louis, MO; Salt Lake City, UT; San Antonio, TX; San Diego, CA; San Francisco, CA; Seattle, WA; and Tampa, FL.
Managing Congestion With Effective Operations
What Causes Congestion?
Put simply, congestion happens when there is either too much demand or too little supply. The high demand (traffic volume) could be a regular fact of life during rush hour, or it could be a special event. The inadequate supply could be caused by too few lanes, a stalled vehicle, a collision, or bad weather.
In stop-and-go conditions, speeds are obviously slower and roadways carry much less traffic. In some cases, only two-thirds of the normal traffic volume can get through bottleneck conditions (meaning a three-lane freeway only handles two lanes worth of traffic). Thus, the "investment return" on the billions of dollars spent on roadways is not nearly as high when speeds and volumes are low. And the volume, speed, and service quality vary from day-to-day, meaning travelers and shippers must allow extra time to ensure an on-time arrival.
How Can Operations Help?
Operational improvements are really just strategies promoting smooth, safe, and consistent traffic flow. For example, successful operations:
- Optimize the green time for traffic signals to ensure the most efficient movement of cars through an intersection.
- Remove crashed or stalled vehicles from roadways in minutes to minimize travel delay and improve safety around crash sites.
- Provide real-time traffic data to travelers so they can plan trips to avoid delays.
Effective operations is a combination of technological capability and professional experience that improve the quality of the traveling experience. Some strategies move more people and freight during the hours of peak demand. Other approaches offer incentives and improved services by encouraging:
- Travel in buses or carpools.
- Travel at different times of day.
- Telecommuting.
- Alternative travel methods that travelers are willing to pay for (e.g., high-occupancy toll lanes).
All effective operational strategies enable urban and rural regions to improve neighborhoods, promote business activity, and regain some of the investment in roadways that is lost to congestion.
Benefits of Effective Operations
Effective operations can benefit communities not only by reducing congestion but by increasing safety by quickly clearing roadways of crashes, alerting travelers to hazardous conditions, and optimizing the transportation network to improve travel conditions. Other benefits of effective operations include:
- More time and more travel options.
- A more predictable trip.
- Less frustrating travel.
- More control over departure time and route.
- Information to make the right choice.
- A cleaner environment due to less vehicle idling.
Shippers and manufacturers also enjoy more reliable delivery schedules, can serve more customers more efficiently, and can use existing plans and distribution centers to serve growing markets.
Operational Innovations That Work
The examples on the following pages show creative, innovative ways communities across the nation have reduced congestion. Each story highlights a particular strategy.
Atlanta, GA: I-285 Ramp Metering
Freeway Ramp Metering
Signals regulate the flow of vehicles onto freeway lanes. The signals ensure there is more space between the entering vehicles, meaning less disruption to freeway traffic. (Benefits: fewer collisions at merge points, faster freeway speeds, and more travelers served)
The Investment
Between 2006 and 2009, the governor's FastForward program dramatically expanded ramp- metering operations. The more than 150 ramp meters were a key element of the regional program, providing system operators a tool to alter the freeway operation in response to unusual events.
The Return
Travel times became faster and more reliable after the ramp meters were turned on. The time penalty for traveling in the peak period declined from about 80 percent to 60 percent. Traffic volume on those sections of freeway increased, meaning more trips were handled on the same lanes.
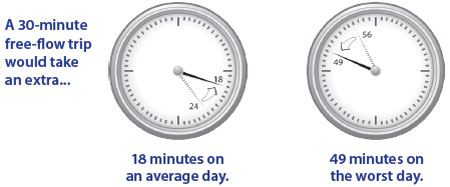 A 30-minute free-flow trip took an extra 24 minutes before ramp metering and 18 minutes after on an average day. A 30-minute free-flow trip took an extra 56 minutes before ramp metering and 49 minutes after on the worst day of the month.
For More Information:
www.dot.state.ga.us/informationcenter/programs/transportation/fastforward/Pages/ShortTerm.aspx
Miami, FL: High-Occupancy/Toll Lane
I-95 Express Lanes
High-Occupancy/Toll Lanes
Using a designated lane to provide travel time savings to bus riders, carpoolers or toll paying customers. (Benefits: faster, more reliable trips)
The Investment
The I-95 Express Lanes combine several congestion-reducing strategies as part of the U.S. Department of Transportation's Urban Partnership Agreement with the Florida Department of Transportation. The formerly under-used high-occupancy vehicle (HOV) lane was transformed into two express lanes as well as:
- Occupancy raised from HOV 2+ to 3+.
- Better, cleaner hybrid-fuel buses on more bus routes.
- Free travel for registered car- and vanpoolers.
- Entrance ramp metering on the regular lanes.
The Return
Everyone has faster and more reliable commutes on the I-95 Express Lanes project:
- Regular-lane speeds rose from 20 mph to 41 mph.
- Regular-lane volumes were up more than 9 percent.
- Evening peak express-lane volume increased by 30 percent.
- Peak-direction express-lane average speed increased from 24 mph to 57 mph.
- Evening transit travel times decreased from 25 minutes to 8 minutes.
- I-95 Express Lanes speeds were above 45 mph more than 99 percent of the time, and delays dropped from 14 minutes to 2 minutes.
More people are able to get to work, home, and other destinations in less time in all modes.
For More Information:
www.95express.com
Kansas City, MO: Improved Information Coordination
Cross-Town Improvement Project (C-TIP)
Freight Management
Traffic sensor data are combined with information about truck and rail cargo deliveries. (Benefits: quick, reliable travel and fewer truck trips)
The Investment
A government and industry collaboration of four railroads, three trucking companies, four terminals, and five public agencies shares information about freight loads that need to be moved. Trucks that would otherwise "return home empty" are now reloaded and given routes that avoid congestion.
The Return
Fewer empty trucks and better routing mean that C-TIP will:
- Allow for better fleet efficiency.
- Reduce truck trips by 22 percent.
- Reduce cross-town and local delivery-truck trips by 82,000 each year.
- Provide benefits equivalent to removing nearly 245,000 personal vehicle trips annually.
- Reduce annual truck vehicle miles traveled by more than 1 million.
For More Information:
www.ctip-us.com/ImexWeb/home.htm
Seattle, WA: Work-Zone Management
Northbound I-5 Bridge Work Zone
Work-Zone Management
Rapid maintenance and long-life materials mean less disruption from road work. Several techniques can be used to get more people and vehicles through a work zone; smoother traffic flow and travel options are the results of operations strategies.
The Investment
An important bridge on northbound I-5 needed major rehabilitation in 2007. One of the three lanes had to be closed in order to accomplish the work in the shortest period of time. An estimated 57,000 vehicles needed to be re-routed. Several work-zone management solutions made the project successful:
- Added transit routes and priority lanes for trucks, buses, and carpools on parallel streets.
- Narrowed lanes and reduced shoulder widths (to keep two lanes open).
- Re-timed traffic signals on parallel streets.
- Incentives for using vanpools.
- Alternate work schedules and job sites.
- Rescheduled truck deliveries.
- Publicity that began one year in advance.
The Return
The project showed the value of an aggressive combination of creative design, incentives, and publicity. While this may have been new three years ago, this operational strategies package is now being used in many work-zone plan:
- 58,000 daily vehicles were moved elsewhere.
- Travel delays were never more than 10 minutes with three lanes open.
- Travel delays only reached 50 minutes with two lanes open; initial estimates were for back-ups of more than 2 hours.
- Many commuters changed routes or modes; several businesses encouraged employees to avoid the congestion by temporarily working elsewhere or taking vacation.
For More Information:
Washington State Department of Transportation Gray Notebook, September 2007. www.wsdot.wa.gov/accountability
Denver, CO: Traffic Signal
System Improvement Program
Signal Coordination
Signals are timed to turn green when groups of cars approach. The intersections can also be monitored to treat buses full of people as though they were 40 cars. (Benefits: smoother flow, fewer stops, and less pollution)
The Investment
Between 2008 and 2012, an annual budget of $3.9 million will fund high-tech traffic signal equipment, communication devices (that allow signals to "talk" about traffic moving through the system), and staff time for analysis and testing.
The Return
In the last four years, 60 signal re-timing projects have been completed, saving Denver-area travelers a total of more than $400 million. The new projects from this program will add about $40 million in savings each year. These types of efficiency projects are widely accepted by the public, can be done quickly, and have numerous safety and air-quality benefits.
Added Benefits
Every Year from a
$3.9 Million Program
- 2 million fewer hours of delay.
- 1 million fewer gallons of fuel used.
- Total $40 million savings.
For More Information:
drcog.org/index.cfm?page=TrafficSignalProgram
Livable Communities and the Future
Improving Communities Through Effective Operations
As evidenced by the success stories here, effective operations not only reduce congestion, they improve communities by making travel more reliable, safer, and cleaner for the environment. They relieve the stress every one of us has felt sitting in traffic, exhaust fumes invading our lungs and honking horns setting us on edge. In short, effective operations help make our communities livable while acknowledging the practical reality that we live in a world where travel is necessary to our daily lives and our economy.
Active Traffic Management: The Next Phase in Congestion Relief
Simply put, the proactive management of transportation demand and roadway capacity is the next step in congestion relief. Active transportation and demand management (ATDM), also known as active traffic management (ATM), is an aggressive and proactive approach that integrates the concept of balancing supply and demand and adds new techniques to existing traffic control technologies to move people, vehicles, and goods quickly, reliably, and safely.
Addressing traffic congestion before breakdown is ATDM's fundamental tenet. For example, by monitoring prevailing traffic conditions, transportation managers can use variable speed limits and lane-control signs to dynamically adjust speed limits and lane use to harmonize traffic flow. By smoothing traffic flow, these systems can work to reduce flow breakdown and the onset of stop-and-go driving behavior (i.e., shockwaves). With ATDM, the full range of available operational and travel demand strategies—from variable speed limits to congestion pricing—are considered, including the various ways these strategies can be integrated together and with existing infrastructure.
Contact Information
For more information on this report, contact Rich Taylor (Rich.Taylor@dot.gov).
Visit the Urban Congestion Report web site for quarterly congestion trend updates: www.ops.fhwa.dot.gov/perf_measurement/ucr/index.htm.

U.S. Department of Transportation
Federal Highway Administration
FHWA-HOP-10-032