Measuring Border Delay and Crossing Times at the US–Mexico Border
Final Report
Automated Crossing and Wait Time Measurement
CHAPTER 7: PHARR-REYNOSA WAIT TIME DATA ANALYSIS
Data Collection and Analysis Period
Pharr has two RFID reader stations in Mexico (R1 and R2) and two RFID reader stations in the United States (R3 and R4) to collect commercial vehicle travel times for segments of the trip. Tag reads have been recorded since October 2009 from three of the four stations, and the fourth station at CBP that enabled wait time measurement has been recoding tag reads since March 25, 2011. Pharr wait time analysis will be presented in two sections: (1) unmatched tag reads with analysis, and (2) matched tag reads with analysis. Graphs for data collected by each reader location are portrayed as being on the Mexico side or US side. Like BOTA, some tags were not readable for various reasons, which resulted in a smaller number of unmatched tag readings for either side of the border compared to the total volume of truck crossings for the same period reported by government border crossing operators.
Matched tag reads for the system at Pharr are the total number of tag IDs that were detected at US reader stations after having been previously detected at Mexico reader stations within a certain buffer period. This period, which was generally set at 120 minutes, is adjustable. The buffer period is necessary to exclude records not showing regular behaviors.
Events both external and internal to the system occurred during this about two and half year period that affected the tag reads. The analysis includes an explanation of what root causes were known to have brought about an anomaly, or if not conclusively proven, speculation as to the root cause.
Unmatched Tag Reads
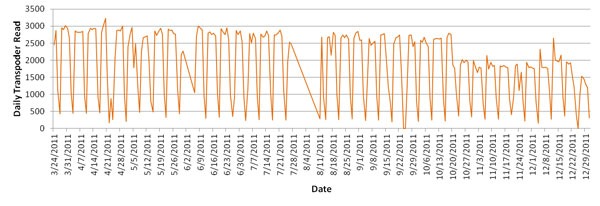
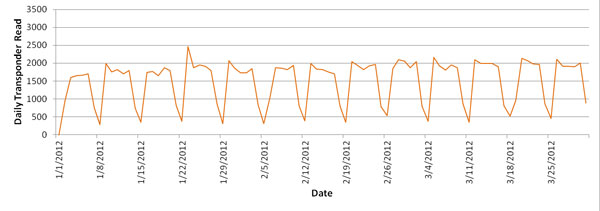
A central database server housed at El Paso office receives transponder (tag) identification data from the field RFID readers. One key objective in analyzing the daily transponder count is to understand the trend of commercial vehicle traffic flow during normal times, planned, and unplanned events that might impact the demand at the port of entry. Another key objective is to keep a log of when hardware failure occurred, for how long, and why. A series of graphs has been developed that are based on the daily count of transponders, read per calendar month by RFID readers on CBP primary inspection facility. These graphs are shown by figure 53 and figure 54.
Matched Tag Reads
Monthly Performance of Border Crossing
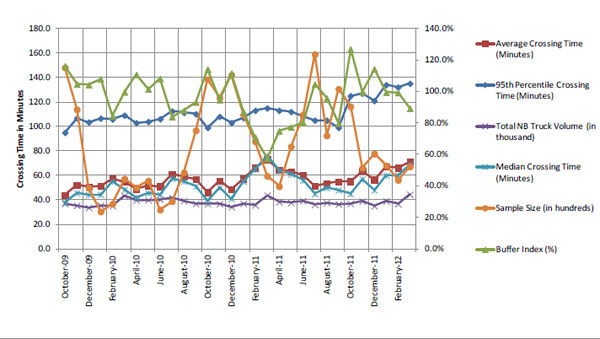
Table 9 shows the monthly average US-bound truck crossing time with various indices at the Pharr-Reynosa POE. The highly variable crossing times seen on this project were due to factors such as the reality that some trucks go through secondary inspection, some are part of the expedited FAST program, and some have trailers that are empty; those have very different crossing times from trucks not in those categories. When the mean crossing time was calculated, it did not distinguish among the crossing times of these trucks; all crossing times are used in calculating the mean. This results in a very high standard deviation and thus high co-efficient of variation.
| Month-Year | Average Crossing Time (Minutes)
(1)
|
95th Percentile Crossing Time (Minutes)
(2)
|
95th - Average
(3) = (2)-(1)
|
Buffer Index (%)
(4)=(3)/(1)
|
Median Crossing Time (Minutes)
(5)
|
Sample Size
(6)
|
|---|---|---|---|---|---|---|
| October-09 | 43.9 | 95.0 | 51.0 | 116.2% | 37.9 | 14811 |
| November-09 | 52.2 | 106.8 | 54.6 | 104.6% | 45.7 | 11383 |
| December-09 | 50.7 | 103.5 | 52.8 | 104.2% | 44.3 | 4974 |
| January-10 | 51.3 | 106.6 | 55.3 | 107.9% | 44.3 | 3040 |
| February-10 | 57.4 | 105.9 | 48.5 | 84.5% | 54.9 | 3677 |
| March-10 | 54.6 | 109.1 | 54.5 | 99.7% | 48.4 | 5728 |
| April-10 | 48.8 | 102.9 | 54.1 | 110.7% | 41.9 | 5003 |
| May-10 | 51.5 | 103.9 | 52.3 | 101.5% | 45.7 | 5565 |
| June-10 | 51.0 | 106.1 | 55.2 | 108.2% | 44.3 | 3198 |
| July-10 | 61.2 | 112.4 | 51.3 | 83.8% | 57.5 | 3878 |
| August-10 | 59.2 | 111.3 | 52.1 | 88.0% | 55.2 | 6233 |
| September-10 | 57.0 | 110.2 | 53.2 | 93.2% | 51.1 | 9669 |
| October-10 | 46.25 | 99.0 | 52.8 | 114.1% | 39.0 | 13845 |
| November-10 | 55.48 | 108.0 | 52.5 | 94.7% | 50.0 | 12344 |
| December-10 | 48.68 | 103.0 | 54.3 | 111.6% | 41.0 | 14196 |
| January-11 | 57.18 | 107.0 | 49.8 | 87.1% | 55 | 10957 |
| February-11 | 66.10 | 113.0 | 46.9 | 71.0% | 65 | 8765 |
| March-11 | 73.06 | 115.0 | 41.9 | 57.4% | 76 | 5945 |
| April-11 | 64.61 | 113.0 | 48.4 | 74.9% | 64 | 5103 |
| May-11 | 63.17 | 112.0 | 48.8 | 77.3% | 61 | 8347 |
| June-11 | 59.91 | 108.0 | 48.1 | 80.3% | 56 | 10950 |
| July-11 | 51.31 | 105.0 | 53.7 | 104.6% | 45 | 15895 |
| August-11 | 53.64 | 105.0 | 51.4 | 95.7% | 50 | 9250 |
| September-11 | 55.06 | 99.0 | 43.9 | 79.8% | 48 | 13059 |
| October-11 | 55.10 | 125.00 | 69.9 | 126.9% | 45 | 11629 |
| November-11 | 63.60 | 127.00 | 63.4 | 99.7% | 57 | 6610 |
| December-11 | 56.48 | 121.00 | 64.5 | 114.2% | 48 | 7767 |
| January-12 | 67.20 | 134.00 | 66.8 | 99.4% | 60.0 | 6815 |
| February-12 | 66.23 | 132.00 | 65.8 | 99.3% | 60.0 | 5620 |
| March-12 | 71.40 | 135.10 | 63.7 | 89.2% | 69.0 | 6719 |
In figure 55, the information in table 9 is graphed. The vertical axis on the left represents crossing time in minutes and the axis on the right represents the buffer index (as a percent). Also included in the chart are the 95th percentile crossing time, average crossing time, total US-bound truck volume, and RFID sample size.
Histogram of Wait Times of Trucks
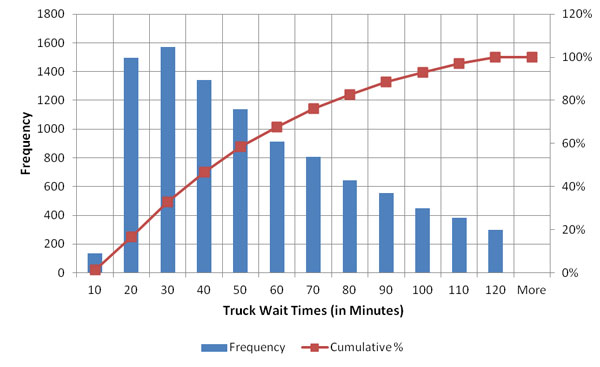
Figure 56 is a histogram of raw wait times over a 29-day period (February 2012). It shows that the 95th percentile of trucks requires approximately 110 minutes or less to wait at the border, and the 50th percentile of trucks requires approximately 45 minutes or less to wait at the border. It should be noted that this histogram is based on the wait time records with less than 120 threshold minutes to exclude outliers such as from the secondary inspection or mismatched RFID tags due to the random reader errors.
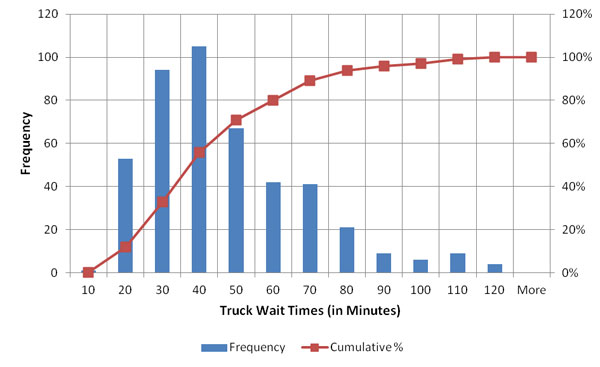
From the figure 56 histogram of raw truck wait time for the month of February 2012, a histogram for a single weekday (February 15, 2012) was prepared, which is shown in figure 57. It shows that the 95th percentile of trucks takes approximately 90 minutes or less to wait at the border, and the 50th percentile of trucks requires approximately 37 minutes or less to wait at the border.
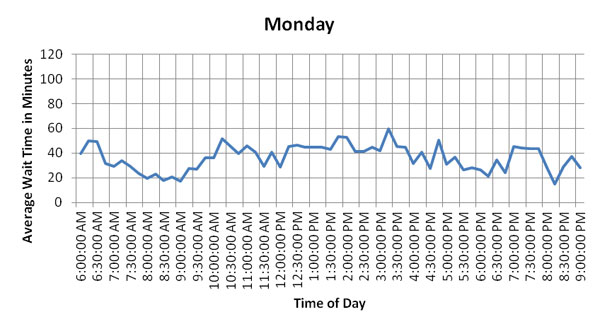
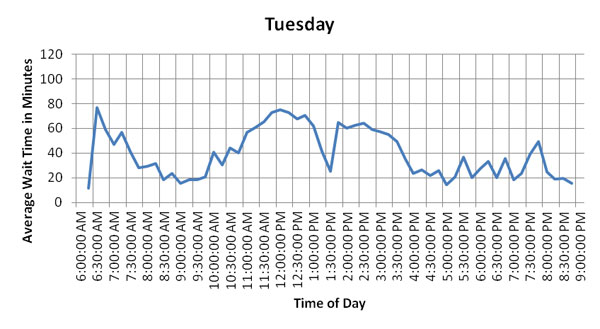
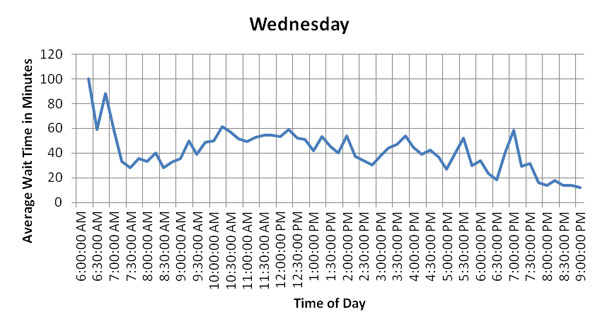
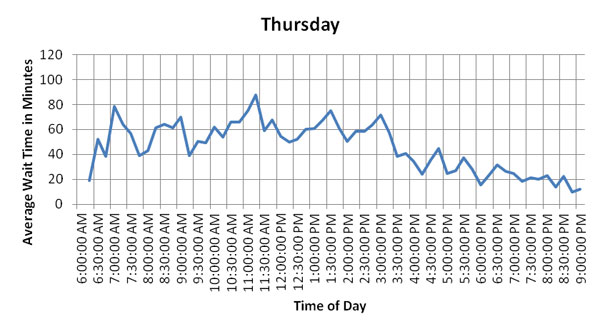
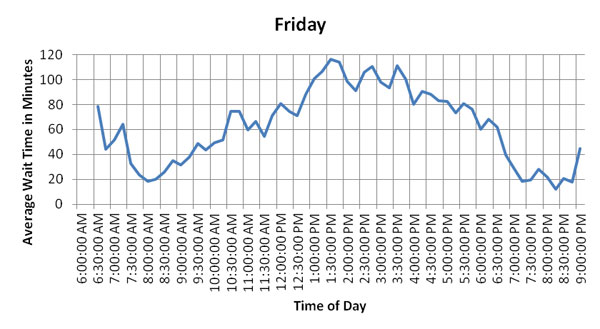
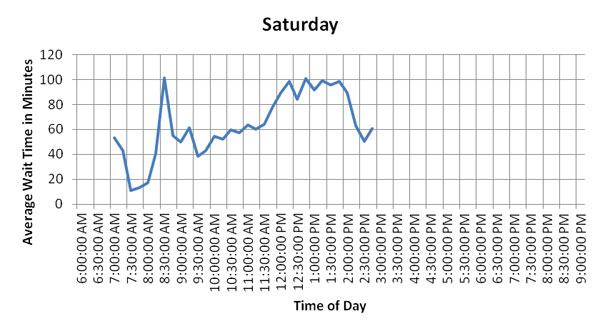
Hourly and Daily Variation of Average Wait Times of Trucks
Figure 58 is a snapshot of hourly and daily variation of average wait times of US-bound commercial vehicles at Pharr for Monday through Saturday, the week of February 13, 2012. The Pharr-Reynosa International Bridge commercial crossing operates from 7:00 AM to 10:00 PM Monday through Friday and from 7:00 AM to 4:00 PM on Saturday and Sunday. These graphs show that average wait times are lower on Monday and Wednesdays. Wait times on Thursday and Friday are higher. Friday peak wait times occur during the early afternoon hours. Since the graphs only captures one week of February, the patterns could be different on the other weeks or months and need to be analyzed further for any possible seasonal or month-to-month trends.