Office of Operations
21st Century Operations Using 21st Century Technologies

Effectiveness of Disseminating Traveler Information on Travel Time Reliability: Implement Plan and Survey Results Report

APPENDIX I. NORTH COLUMBUS TRANSPORTATION STUDY WEBSITE CONCEPT

Slide 1

North Columbus Transportation Study
Website Organization
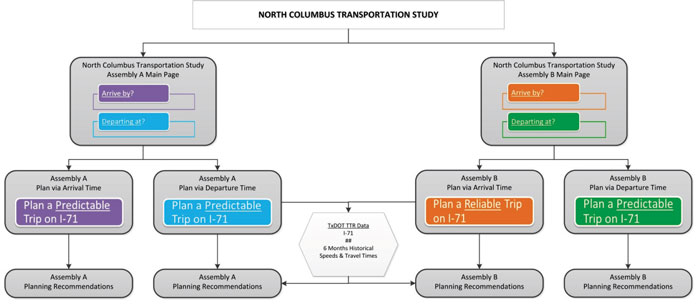
This figure presents a flowchart of the organization of the website used for trip planning, with Assembly A and Assembly B shown on the left and right side of the page, respectively. It shows that the first question is whether the trip is to be planned based on arrival time or departure time. Subsequent questions are based on this choice.  Each flowchart bubble on this page is detailed on the succeeding slides in the appendix.

Slide 2

North Columbus Transportation Study
Main page: Assembly A
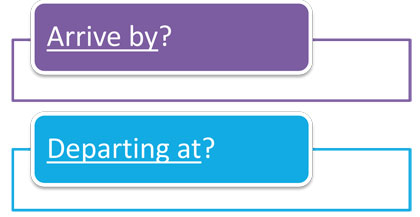
This figure shows the two options presented to the user for which criteria to use to plan a trip (Arrive by?, Departing at?) for Assembly A.

Slide 3

North Columbus Transportation Study
Main page: Assembly B
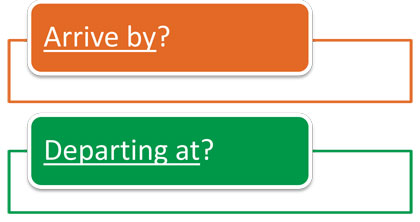
This figure shows the two options presented to the user for which criteria to use to plan a trip (Arrive by?, Departing at?) for Assembly B.

Slide 4

North Columbus Transportation Study
ASSEMBLY A (Arrival)
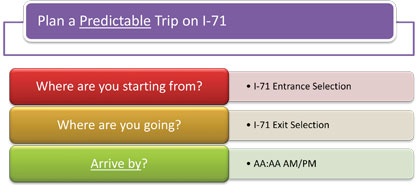
This figure shows the questions presented to the user for planning a predictable trip on I-71 (Where are you starting from?, Where are you going?, Arrive by?) based on Arrival Time for Assembly A.

For your trip on I-71:
  • Your estimated travel time will be XX minutes.
  • Plan YY minutes of extra time to arrive by AA:AA AM/PM.
  • The majority of the time, your trip will take XX minutes or less.
  • Your recommended departure time is DD:DD AM/PM.

Reliability Data Needs

  • Recommended departure time: Arrival Time – 95th Percentile Travel Time
  • Majority of the time: 95th Percentile Travel Time
  • Estimate travel time: Average Travel Time
  • Extra time: Buffer Time (95th Percentile Travel Time – Average Travel Time)

Slide 5

North Columbus Transportation Study
ASSEMBLY A (Departure)
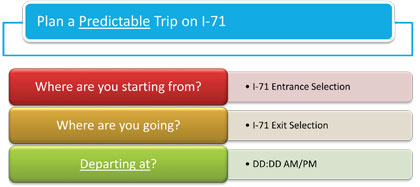
This figure shows the questions presented to the user for planning a predictable trip on I-71 (Where are you starting from?, Where are you going?, Departing at?) based on Departure Time for Assembly A.

For your trip on I-71:
  • Your estimated travel time will be XX minutes.
  • Plan YY minutes of extra time if you are departing at DD:DD AM/PM.
  • The majority of the time, your trip will take XX minutes or less.
  • You will arrive by AA:AA AM/PM at your destination.

Slide 6

North Columbus Transportation Study
ASSEMBLY B (Arrival)
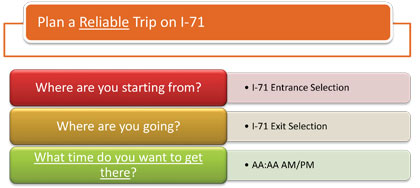
This figure shows the questions presented to the user for planning a reliable trip on I-71 (Where are you starting from?, Where are you going?, What time do you want to get there?) based on Arrival Time for Assembly B.

For your trip on I-71:
  • Yur approximate travel time will be XX minutes.
  • A recommended cushion of YY minutes will get you there by AA:AA AM/PM.
  • Most of the time, your trip will take XX minutes or less.
  • Your suggested departure time is DD:DD AM/PM.

Slide 7

North Columbus Transportation Study
ASSEMBLY B (Departure)
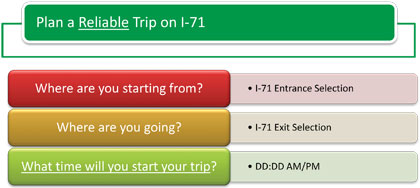
This figure shows the questions presented to the user for planning a reliable trip on I-71 (Where are you starting from?, Where are you going?, What time will you start your trip?) based on Departure Time for Assembly B.

For your trip on I-71:
  • Your approximate travel time will be XX minutes.
  • Use a recommended cushion of XX minutes if you start you trip at DD:DD AM/PM.
  • Most of the time, your trip will take XX minutes or less.
  • You will get there by AA:AA AM/PM.

Reliability Data Needs

  • recommended departure time / suggested departure time: Arrival Time – 95th Percentile Travel Time
  • majority of the time / most of the time: 95th Percentile Travel Time
  • estimated travel time / approximate travel time: Average Travel Time
  • extra time / recommended cushion: Buffer Time (95th Percentile Travel Time – Average Travel Time)
Office of Operations