2019 Road Weather Management Performance Measures UpdateAppendix A: State Department of Transportation SurveyThis appendix summarizes the State departments of transportation (DOT) survey questions and results. Q4. Does your agency regularly collect and report road weather performance measures? (This may include dashboards, winter maintenance reports, seasonal summaries, etc.)Related performance measure (PM): Number of agencies that collect and report road weather-related performance measures to the public.
Number Responded
39
Number Skipped
0

Figure 21. Chart. Responses from State department of transportation survey question 4. Q5. Does your agency calculate a "winter severity index" to compare performance across events or across years?Related PM: Number of agencies that collect and report road weather-related performance measures to the public.
Number Responded
39
Number Skipped
0
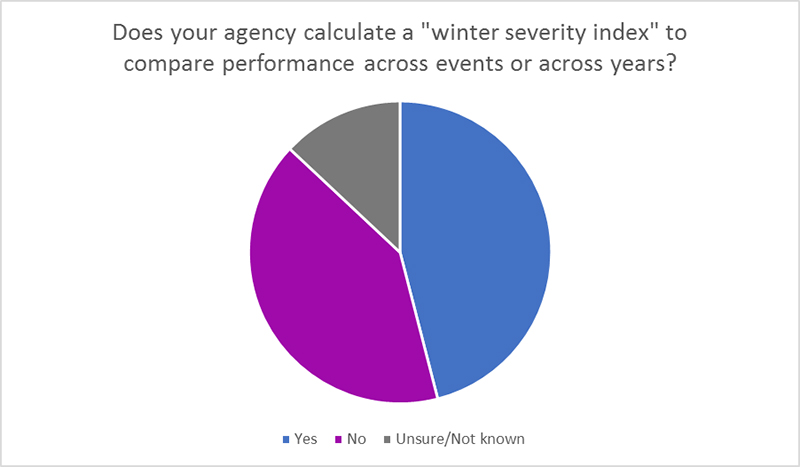
Figure 22. Chart. Responses from State department of transportation survey question 5. Q6. Does your agency have a process for evaluating the return on investment (ROI) or net benefits of road weather management investments?Related PM: Number of agencies that have a process for evaluating the return on investment (ROI) or net benefit of their road weather management investments.
Number Responded
39
Number Skipped
0
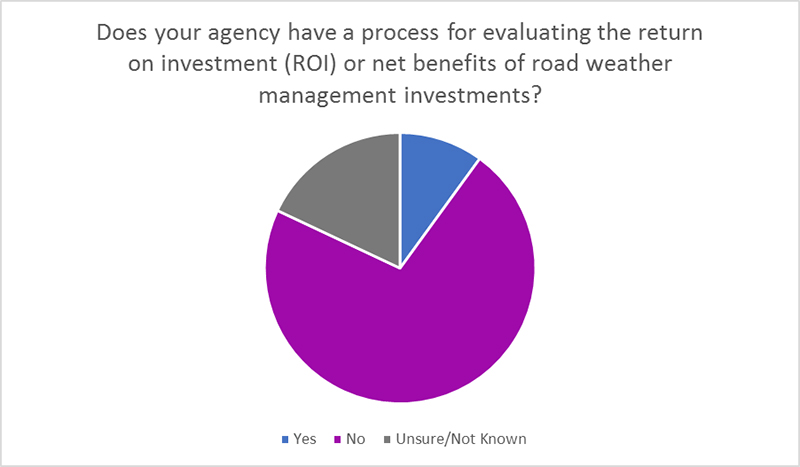
Figure 23. Chart. Responses from State department of transportation survey question 6. Q7. What are your agency's sources of weather and road weather information? (Check all that apply):Related PM: Number of DOTs that subscribe to road weather products and services.
# Respondents Who Answered Question
39
# Respondents Who Skipped Question
0
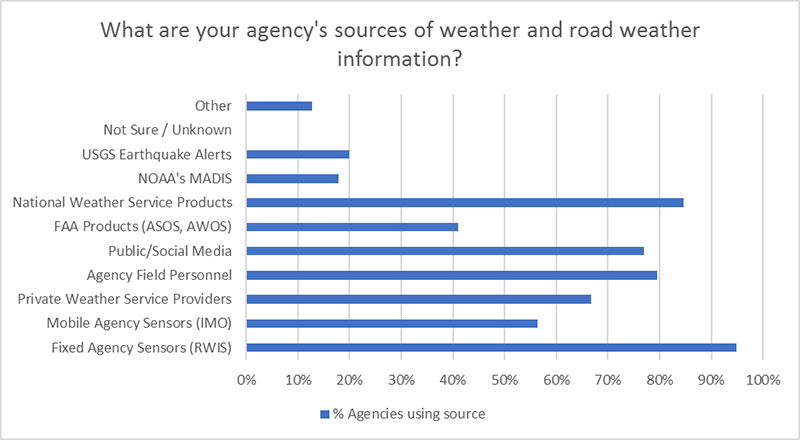 The x-axis ranks how much the agency uses the source from 0% to 100% in increments of 10%. The y-axis the labels the bars in the graph by showing the categories of Other, Not Sure/Unknown, USGS Earthquake Alerts, NOAA's MADIS, National Weather Service Products, FAA Products (ASOS, AWOS), Public/Social Media, Agency Field Personnel, Private Weather Service Providers, Mobile Agency Sensors (IMO), and Fixed Agency Sensors (RWIS). A majority of respondents used NWS or RWIS products.
Figure 24. Graph. Responses from State department of transportation survey question 7. Other responses included:
Q7.1: Does your agency have a signed data sharing agreement with the following? (Check all that apply):Related PM: Number of DOTs that subscribe to road weather products and services.
# Respondents Who Answered Question
38
# Respondents Who Skipped Question
1
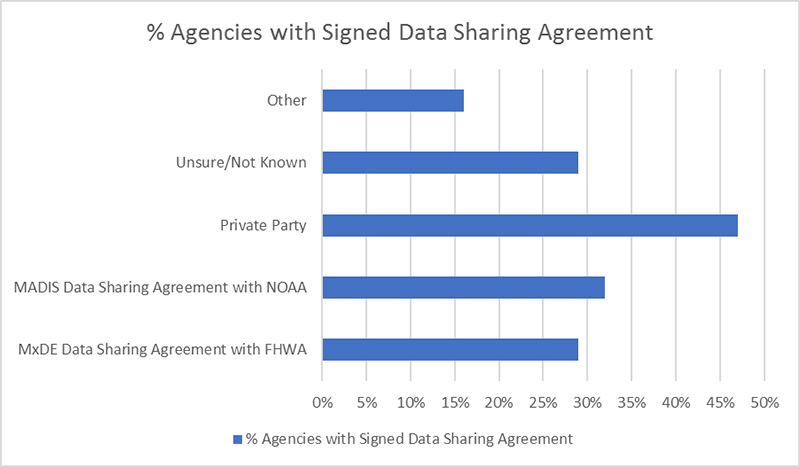 The x-axis ranks the percentage from 0% to 50% and increases in increments of 5%. The y-axis ranks the kind of agency agreement with the categories of Other, Unsure/Not Known, Private Party, MADIS Data Sharing Agreement with NOAA, and MxDE Data Sharing Agreement with FHWA. Private Party was the most popular agency agreement with over 46% of agencies having a signed data sharing agreement with it.
Figure 25. Graph. Responses from State department of transportation survey question 8. Other responses included:
Q8. Does your agency collect real-time field data from maintenance vehicles?Related PM: Number of State DOTs collecting mobile observations of road weather data from vehicle fleets.
# Respondents Who Answered Question
39
# Respondents Who Skipped Question
0
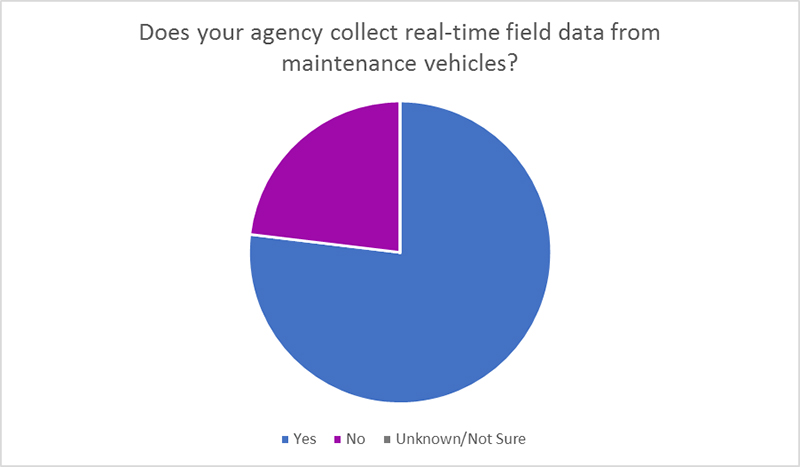
Figure 26. Chart. Responses from State department of transportation survey question 8. Q8.1. If you answered "Yes" to question #8, which of the following data are collected from maintenance vehicles, and from what percentage of the applicable fleets? (Check all that apply):Related PM: Number of State DOTs collecting mobile observations of road weather data from vehicle fleets.
Q9. How many Environmental Sensor Stations (ESS) does your state agency operate statewide?Related PM: Number of State DOTs reporting the use of Environmental Sensor Stations (ESS) in operations and maintenance activities.
# States Responded
35
# States Skipped
3
Q9.1. Describe how you use your ESS (Check all that apply):Related PM: Number of State DOTs reporting the use of Environmental Sensor Stations (ESS) in operations and maintenance activities.
# Respondents Who Answered Question
38
# Respondents Who Skipped Question
1
 The x-axis shows the percentage of use from 0% to 100% and increases in increments of 20%. The y-axis displays how ESS is used with the categories of Other, Not Sure/Unknown, Support Traffic Management and Maintenance-Decision Making (e.g., MDSS), Input for Segment-Level Forecasts, and Provide Current Conditions to Traveler Information Systems. Support Traffic Management and Maintenance-Decision Making (e.g., MDSS) was the most common ESS use.
Figure 27. Graph. Responses from State department of transportation survey question 9.1. Q10. Has your agency developed applications or tools that rely on availability of real-time mobile data from vehicle fleets and/or vehicle-to-infrastructure connectivity?Related PM: Number of/percentage of responding agencies using mobile data-based applications in road weather management.
Number Responded
36
Number Skipped
3
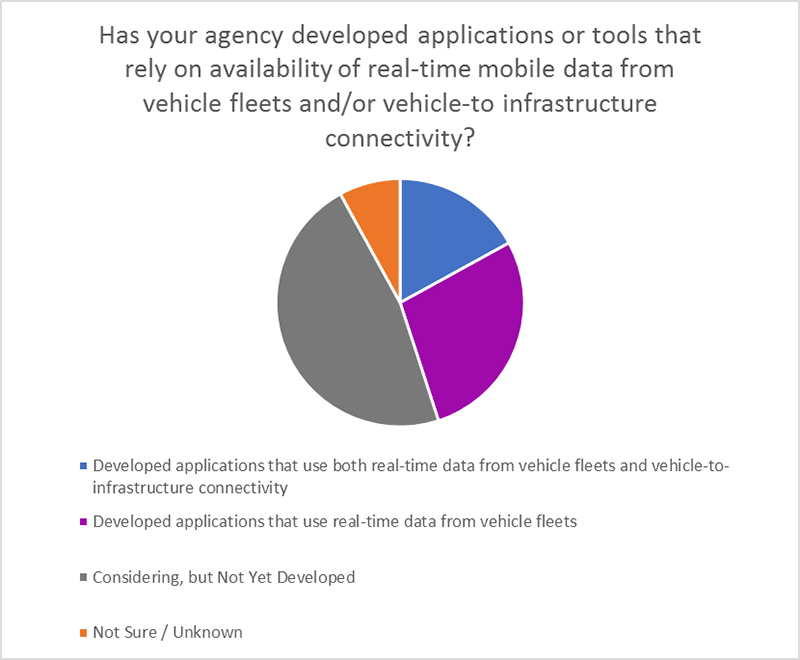 On the bottom half of the page, a pie graph shows if agencies developed applications for real-time mobile data from vehicle fleets or vehicle-to infrastructure connectivity. Close to half were considering, but had not yet developed an application, over a quarter had developed an application from vehicle fleets, about a sixth had developed an application for real-time mobile data from vehicle fleets or vehicle-to infrastructure connectivity, and about 10% wasn't sure.
Figure 28. Chart. Responses from State department of transportation survey question 10. Q11. Describe the level of deployment in your agency of the following road weather information strategies. (Check all that apply):Related PM: Number of states disseminating advisory weather and road weather information to travelers.
# Respondents Who Answered Question
39
# Respondents Who Skipped Question
0
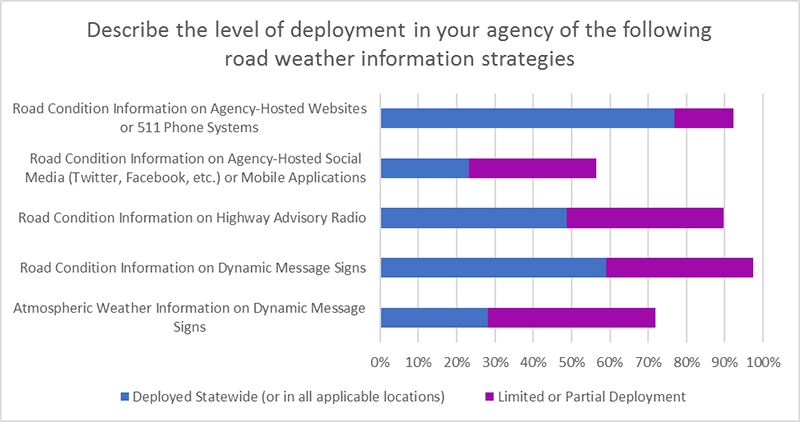 On the top half of the page, a horizontal graph shows Road Weather Information Strategies Level of Deployment. The x-axis ranks the level of deployment on a scale of 0% to 100% and increases in 10% increments. The bars are made up of Deployed Statewide (or in all applicable locations) and Limited or Partial Deployment. The y-axis categorizes the strategies into the categories of Road Condition Information on Agency-Hosted Websites or 511 Phone Systems, Road Condition Information on Agency-Hosted Social Media (Twitter, Facebook etc.) or Mobile Applications, Road Condition Information on Highway Advisory Radio, Road Condition Information on Dynamic Message Signs, and Atmospheric Weather Information on Dynamic Message signs.
Figure 29. Graph. Responses from State department of transportation survey question 11. Q11.1. Was your agency's decision to deploy any of the road weather information strategies identified influenced by FHWA's Pathfinder initiative?Related PM: Number of states disseminating advisory weather and road weather information to travelers.
# Respondents Who Answered Question
37
# Respondents Who Skipped Question
2
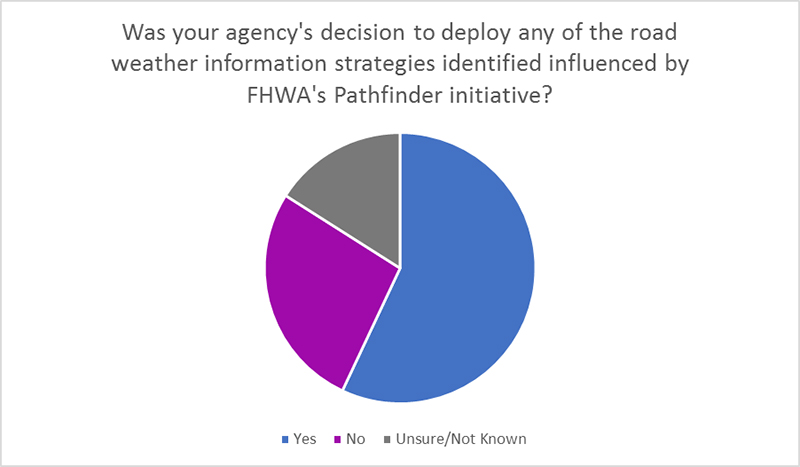
Figure 30. Chart. Responses from State department of transportation survey question 11.1. Q12. Has your agency deployed safety warning systems related to road weather events?Related PM: Number of states disseminating advisory weather and road weather information to travelers.
# Respondents Who Answered Question
38
# Respondents Who Skipped Question
1

Figure 31. Chart. Responses from State department of transportation survey question 12. Q12.1. If you answered "Yes" to question #12, please select which types of hazards are included in your agency's safety warning system(s). (Check all that apply):Related PM: Number of states disseminating advisory weather and road weather information to travelers.
# Respondents Who Answered Question
20
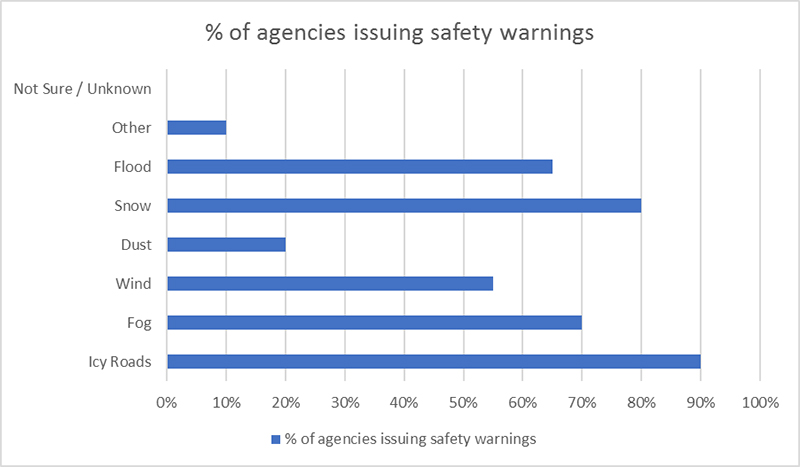 On the top half of the page, a horizontal graph shows agencies that issued safety warnings based upon a variety of hazards. The x-axis shows the percent of agencies from 0% to 100% and increases in increments of 10%. The y-axis shows the hazard categories and includes other, flood, snow, dust, wind, fog, and icy roads. Icy Roads and Snow were the two most popular hazards included.
Figure 32. Graph. Responses from State department of transportation survey question 12.1. Other responses included:
Q13. Describe the level of deployment in your agency of the following weather responsive traffic management strategies. (Check all that apply):Related PM: Number of agencies using control and treatment strategies during weather events.
# Respondents Who Answered Question
39
# Respondents Who Skipped Question
0
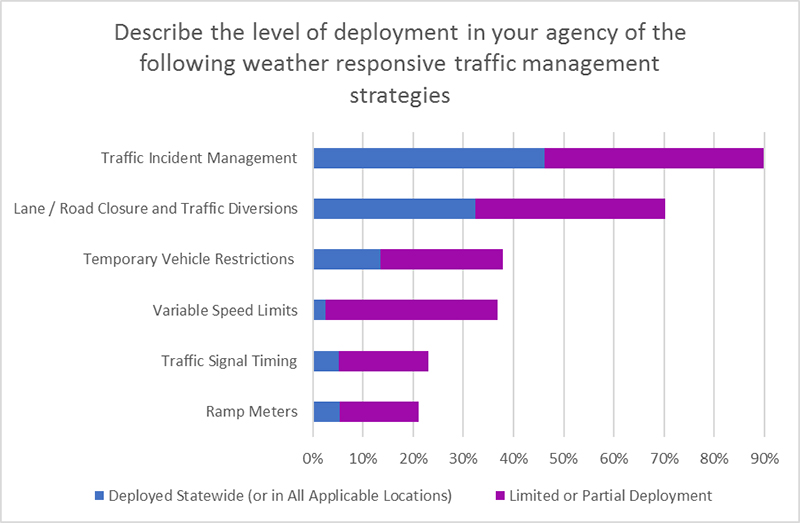 A figure on the bottom half of the page shows weather responsive traffic management strategies deployment levels. The x-axis shows the percentage ranking scale from 0% to 90% that increases in increments of 10% and rates the two categories that make the up the bars including deployed statewide (or in all applicable locations) and limited or partial deployment. The y-axis shows the strategies including traffic incident management, lane/road closure and traffic diversions, temporary vehicle restrictions, variable speed limits, traffic signal timing, and ramp meters. Traffic incident management was the most popular strategy with a total of about 90% evenly divided between the two categories that make up the bar.
Figure 33. Graph. Responses from State department of transportation survey question 13. Q14. Describe your level of interaction with the National Weather Service local forecast offices for road weather management and operations activities.Related PM: Number of agencies that coordinate with their local forecast offices for road weather management and operations.
Total
39
Number Skipped
0

Figure 34. Chart. Responses from State department of transportation survey question 14. Q15. Does your agency use a winter Maintenance Decision Support System (MDSS) for snow and ice control? A winter MDSS includes software that proves strategic and tactical weather forecasts, supports treatment decision making and provides summary reports of weather event performance.Related PM: Number of agencies adopting MDSS technologies and methods.
Total
39
Number Skipped
0
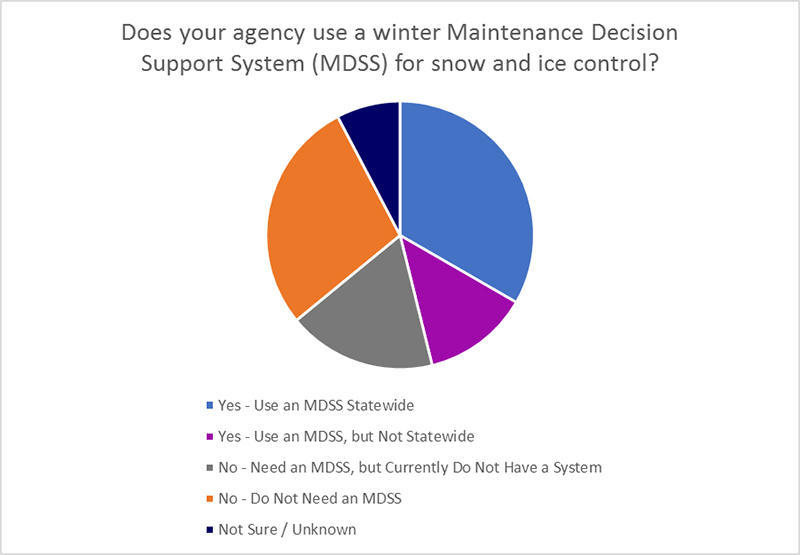
Figure 35. Chart. Responses from State department of transportation survey question 15. Q15.1. If you answered "No — need an MDSS, but currently do not have a system" to question #15, please provide the reason(s)for the lack of implementation.Related PM: Number of agencies adopting MDSS technologies and methods.
Q16. Does your agency use other decision support tools (besides a winter MDSS) for road weather management? If yes, what are these tools used for? (Check all that apply):Related PM: Number of agencies using other weather-related decision support tools.
Total
39
Number Skipped
0
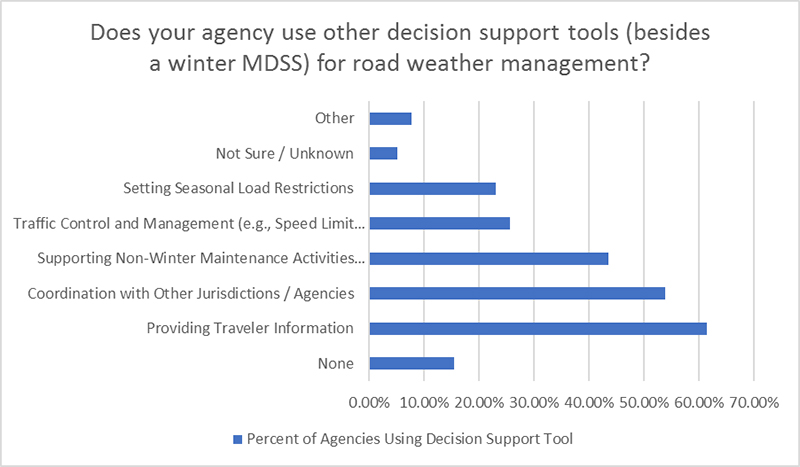 A horizontal table shows agencies that use other decision support tools besides MDSS for road weather management. The x-axis shows the percentage of agencies other tools from 0% to 70% and increases in increments of 10%. The y-axis shows the other tools used including other, not sure/unknown, setting seasonal load restrictions, traffic control management, supporting non-winter maintenance activities, coordination with other jurisdictions/agencies, providing traveler information, and none. Supporting non-winter maintenance activities, coordination with other jurisdictions/agencies, and providing traveler information all ranked the highest by far.
Figure 36. Graph. Responses from State department of transportation survey question 16. Other responses included:
Q17. What types of traffic analysis and simulation tools does your agency use for planning and evaluating road weather management strategies? (Check all that apply):Related PM: Number of agencies reporting use of appropriate analysis tools to factor weather impacts and strategies.
Total
37
Number Skipped
2
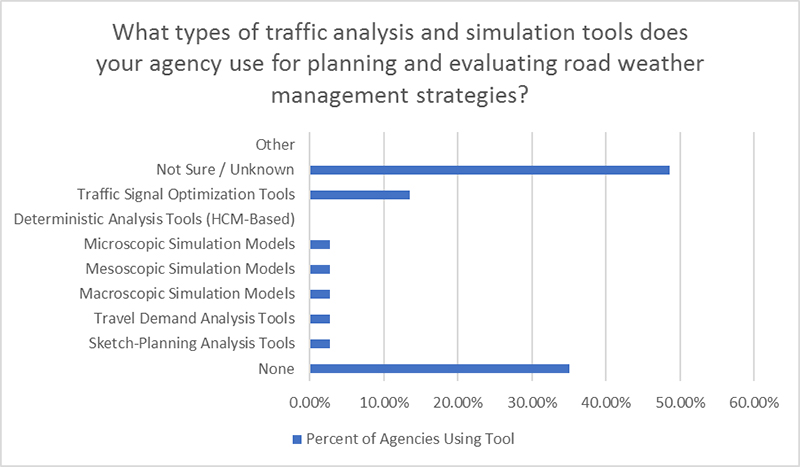 A horizontal bar graph on the bottom half of the page shows traffic analysis and simulation tools used by agencies for planning and evaluating road weather management strategies. The x-axis shows percent of agencies using the tool and goes from 0% to 60% in 10% increments. The y-axis shows the type of tools including other, not sure/unknown, traffic signal optimization tools, deterministic analysis tools (HCM based), microscopic simulation tools, mesoscopic simulation tools, macroscopic simulation tools, travel demand analysis tools, sketch-planning analysis tools, and none. Traffic signal optimization tools were the most popular tool.
Figure 37. Graph. Responses from State department of transportation survey question 17. Q18. Has your agency (and, in particular, road weather management related staff) participated in extreme weather, transportation resilience, or climate adaptation practices/reviews?Related PM: Number of agencies conducting vulnerability/risk assessment or developing/implementing resiliency plans, for their road weather management infrastructure and processes to respond to extreme weather.
Total
36
Number Skipped
3
 The horizontal bar graph shows agencies that have participated in extreme weather, transportation resilience, or climate adaptation practices/reviews. The x-axis ranks the percent of agencies that have participated in the activity from 0% to 50% and increases in increments of 5%. The y-axis categorizes the extent of their participation with the categories not sure/unknown, agency has not participated in development of adaptation practices, participated in state DOT resilience adaptation planning activities, developed/implemented resiliency plans for road weather management infrastructure, developed/implemented process for responding to extreme weather, and conducted a vulnerability/risk assessment for road weather management infrastructure. By far, most agencies had participated in the development/implementation of a process for responding to extreme weather with over 45% of agencies having done so.
Figure 38. Graph. Responses from State department of transportation survey question 18. Q19. Would you be willing to participate in the next update of this survey?Related PM: Number of agencies that have a process for evaluating the return on investment (ROI) or net benefit of their road weather management investments.
# Respondents Who Answered Question
38
# Respondents Who Skipped Question
1
10 ASOS = Automated Surface Observing System. AWOS = Automated Weather Observation System. FAA = Federal Aviation Administration. NOAA = National Oceanic and Atmospheric Administration. RWIS = Road Weather Information System. USGS = U.S. Geological Survey. [ Return to Note 10 ] | |||||||||||||||||||||||||||||||||||||||||||||||||||||||||||||||||||||||||||||||||||||||||||||||||||||||||||||||||||||||||||||||||||||||||||||||||||||||||||||||||||||||||||||||||||||||||||||||||||||||||||||||||||||||||||||||||||||||||||||||||||||||||||||||||||||||||||||||||||||||||||||||||||||||||||||||||||||||||||||||||||||||||||||||||||||||||||||||||||||||||||||||||
|
United States Department of Transportation - Federal Highway Administration |
||