

How Do Weather Events Affect Roads?
Every year, adverse road weather conditions contribute to thousands of crashes in the United States. Adverse road weather includes precipitation from rain, snow, and sleet; high and gusting winds; and low visibility conditions from fog, smoke, dust, and blowing snow; as well as slippery road surface conditions that can cause unsafe driving conditions.
|
Weather Effects on Safety
- On average, there are over 6,035,000 million vehicle crashes each year. Approximately 12 percent of these crashes - nearly 745,000 - are weather-related. Weather-related crashes are defined as those crashes that occur in adverse atmospheric weather conditions (e.g., rain, sleet, hail, snow, freezing rain or drizzle, fog, smog, smoke, severe crosswinds, or blowing snow, sand, soil or dust). On average, over 3,800 people are killed and over 268,000 people are injured in weather-related crashes each year. (Source: Five-year averages from 2019 to 2023 analyzed by Athey Creek Consultants, based on NHTSA data).
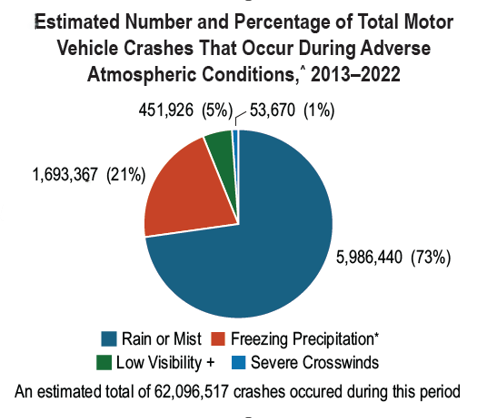
- Over 77 percent of most weather-related crashes happen during rain or mist conditions. A much smaller percentage of weather-related crashes occur during other adverse conditions: 18 percent during freezing precipitation (e.g., snow, sleet, hail, or freezing rain or drizzle), 4 percent during low visibility conditions (e.g., fog, smog, smoke, blowing snow, or blowing sand, soil, or dirt), and 1 percent during severe crosswinds. (Source: Five-year averages from 2019 to 2023 analyzed by Athey Creek Consultants, based on NHTSA data).
Table: Weather-Related* Crash Statistics (Annual Averages)Weather-Related* Crash StatisticsFive-Year Average (2019-2023)Five-Year PercentagesWeather-Related* Crashes, Injuries, and Fatalities 744,911 estimated crashes 12% of motor vehicle crashes 268,239 estimated persons injured 11% of estimated crash injuries 3,807 persons killed 9% of crash fatalities
* Weather-related* crashes are those that occur in the presence of adverse atmospheric weather conditions
Table: Weather-Related* Crash Statistics (Annual Averages)Road Weather Conditions Weather-Related Crash StatisticsFive-Year Average (2019 - 2023)Five-Year PercentagesRain
(includes mist)574,047 estimated crashes 10% of estimated vehicle crashes 7% of weather-related estimated crashes 219,039 estimated persons injured 9% of estimated crash injuries 82% of weather-related estimated injuries 2,810 persons killed 7% of crash fatalities 74% of weather-related fatalities Freezing Precipitation
(includes snow, sleet, hail, or freezing rain or drizzle)219,942 estimated crashes 2% of estimated vehicle crashes 18% of weather-related estimated crashes 34,206 estimated persons injured 1% of estimated crash injuries 13% of weather-related estimated injuries 407 persons killed 1% of crash fatalities 11% of weather-related fatalities Low Visibility
(includes fog, smog, smoke, blowing snow, or blowing sand, soil, or dirt)32,871 estimated crashes 1% of estimated vehicle crashes 4% of weather-related estimated crashes 11,292 estimated persons injured 1% of estimated crash injuries 4% of weather-related estimated injuries 488 persons killed 1% of crash fatalities 13% of weather-related fatalities Severe Crosswinds 5,870 estimated crashes 0.1% of estimated vehicle crashes 1% of weather-related estimated crashes 2,426 estimated persons injured 0.1% of estimated crash injuries 1% of weather-related estimated injuries 65 persons killed 0.2% of crash fatalities 2% of weather-related fatalities - By crash type (not shown in above table) for an average year, roughly 9% of fatal crashes, 11% of estimated injury crashes, and 13% of estimated property-damage-only (PDO) crashes occur in the presence of adverse atmospheric weather conditions. That is on an annual basis, over 3,400 fatal crashes, over 191,000 estimated injury crashes and over 550,000 PDO crashes occur in adverse atmospheric weather conditions. (Source: Five-year averages from 2019 to 2023 analyzed by Athey Creek Consultants, based on NHTSA data).
* "Weather-Related" crashes are those that occur in the presence of adverse weather conditions.
Weather Effects on Mobility
- Capacity reductions can be caused by lane submersion due to flooding and by lane obstruction due to snow accumulation and wind-blown debris. Road closures and access restrictions due to hazardous conditions (e.g., large trucks in high winds) also decrease roadway capacity.
- Weather events can reduce arterial mobility and reduce the effectiveness of traffic signal timing plans. On signalized arterial routes, speed reductions can range from 10 to 25 percent on wet pavement and from 30 to 40 percent with snowy or slushy pavement. Average arterial traffic volumes can decrease by 15 to 30 percent depending on road weather conditions and time of day. Saturation flow rate reductions can range from 2 to 21 percent. Travel time delay on arterials can increase by 11 to 50 percent and start-up delay can increase by 5 to 50 percent depending on severity of the weather event. (Sources: "Weather Impacts on Arterial Traffic Flow (PDF 92KB)" and "Weather-Responsive Traffic Signal Control (DOC 399KB)")
- On freeways, light rain or snow can reduce average speed by 3 to 13 percent.
Heavy rain can decrease average speed by 3 to 16 percent. In heavy snow,
average freeway speeds can decline by 5 to 40 percent. Low visibility can
cause speed reductions of 10 to 12 percent. Free-flow speed can be reduced
by 2 to 13 percent in light rain and by 6 to 17 percent in heavy rain.
Snow can cause free-flow speed to decrease by 5 to 64 percent. Speed variance
can fall by 25 percent during rain. Light rain can decrease freeway capacity
by 4 to 11 and heavy rain can cause capacity reductions of 10 to 30 percent.
Capacity can be reduced by 12 to 27 percent in heavy snow and by 12 percent
in low visibility. Light snow can decrease flow rates by 5 to 10 percent.
Maximum flow rates can decline by 14 percent in heavy rain and by 30 to
44 percent in heavy snow. (Sources: "Highway Capacity Manual
2000" Chapter 22, "Capacity-Reducing Occurrences", "Driver
Response to Rainfall on an Urban Expressway", "Impact
of Weather on Urban Freeway Traffic Flow Characteristics and Facility Capacity", Empirical Studies on Traffic Flow in Inclement Weather: Summary Report".
Table: Freeway Traffic Flow Reductions due to WeatherWeather Conditions Freeway Traffic Flow ReductionsAverage Speed Free-Flow Speed Volume Capacity Light Rain/Snow 3% - 13% 2% - 13% 5% - 10% 4% - 11% Heavy Rain 3% - 16% 6% - 17% 14% 10% - 30% Heavy Snow 5% - 40% 5% - 64% 30% - 44% 12% - 27% Low Visibility 10% - 12% 
12% - It has been estimated that 23 percent of the non-recurrent delay on highways across the nation is due to snow, ice, and fog. This amounts to an estimated 544 million vehicle-hours of delay per year. Rain—which occurs more frequently than snow, ice, and fog—leads to greater delay. During adverse weather average travel time delay increases by 14 percent in Washington, D.C. and by 21 percent in Seattle, WA. During peak periods in Washington, D.C. travel time increases by roughly 24 percent in the presence of precipitation. (Sources: " Highway Capacity Manual 2000" Chapter 22, "Temporary Losses of Highway Capacity and Impacts on Performance", " An Investigation into the Impact of Rainfall on Freeway Traffic Flow" and "Analysis of Weather Impacts on Traffic Flow in Metropolitan Washington DC" (PDF 1.4MB))
Weather Effects on Productivity
- Adverse weather can increase operating and maintenance costs of winter road maintenance agencies, traffic management agencies, emergency management agencies, law enforcement agencies, and commercial vehicle operators (CVOs).
- Winter road maintenance accounts for roughly over 24 percent of state DOT budgets for highway and traffic services. Each year, state and local agencies spend more than 4.6 billion dollars on snow and ice control operations. (Sources: "Highway Statistics Publications, Highway Finance Tables SF-4C and LGF-2," 2019 to 2023, https://www.fhwa.dot.gov/policy/ohpi/hss/hsspubs.cfm)
- Each year trucking companies or CVOs lose an estimated 32.6 billion vehicle hours due to weather-related congestion in 281 of the nation's metropolitan areas. Adverse weather conditions affect freight traffic 4.6 percent of the time at a national average. Nearly 12 percent of total estimated truck delay is due to weather in the 20 cities with the greatest volume of truck traffic. The cost of weather-related delay to the freight industry was estimated at $8.659 billion or 1.6 percent of the total estimated freight market of $574 billion when the study was conducted in 2012. (Sources: " Analysis of Weather Incident Effects on Commercial Vehicle Mobility in Large U.S. Cities," Mitretek Systems and "Weather Delay Costs to Trucking").
- Road treatment strategy (e.g., snow and ice control)
- Construction planning (e.g., paving and striping)
- Visibility distance (due to blowing snow, dust)
- Lane obstruction (due to wind-blown snow, debris)
- Traffic speed
- Travel time delay
- Accident risk
- Vehicle performance (e.g., stability)
- Access control (e.g., restrict vehicle type, close road)
- Evacuation decision support
- Visibility distance
- Pavement friction
- Lane obstruction
- Roadway capacity
- Traffic speed
- Travel time delay
- Accident risk
- Vehicle performance (e.g., traction)
- Driver capabilities and behavior
- Road treatment strategy
- Traffic signal timing
- Speed limit control
- Evacuation decision support
- Institutional coordination
- Visibility distance
- Traffic speed
- Speed variance
- Travel time delay
- Accident risk
- Driver capabilities/behavior
- Road treatment strategy
- Access control
- Speed limit control
- Infrastructure damage
- Road treatment strategy
- Pavement friction
- Infrastructure damage
- Roadway capacity
- Traffic speed
- Travel time delay
- Accident risk
- Vehicle performance
- Driver capabilities/behavior (e.g., route choice)
- Road treatment strategy
- Traffic signal timing
- Speed limit control
- Lane submersion
- Traffic speed
- Travel time delay
- Accident risk
- Access control
- Evacuation decision support
- Institutional coordination
The table below, summarizes the effects of various weather events on roadways, traffic flow, and operational decisions.
| Table: Weather Effects on Roads, Traffic and Operational Decisions | |||
|---|---|---|---|
| Road Weather Variables | Roadway Effects | Traffic Flow Effects | Operational Effects |
| Air temperature and humidity | |||
| Wind speed | |||
| Precipitation (type, rate, start/end times) |
|||
| Fog | |||
| Pavement temperature | |||
| Pavement condition | |||
| Water level | |||
To view PDF files, you need the Adobe Acrobat Reader.
To view DOC files, you need the Microsoft Word Viewer.
