Work Zone Mobility and Safety Program

Data Needs, Availability, and Opportunities for Work Zone Performance Measures Webinar
March 19, 2013
Presentation

slide 1

Data Needs, Availability and Opportunities for Work Zone Performance Measures

March 19, 2013

Presenters: Jawad Paracha (FHWA), Gerald Ullman (TTI), Geza Pesti (TTI) and Rachel Klein (Battelle)

USDOT FHWA logo.   Battelle logo.   Texas Transportation Institute logo.


Download the Printable Version [PDF, 4.3 MB]
PDF files can be viewed with the Acrobat® Reader®.


slide 2

Webinar Structure

  • Introduction (FHWA)
  • Guidance Development Challenges and Process
  • Structure of the Guidance Document
  • Mobility Measures and Data Sources
    • Q&A
  • Safety Measures and Data Sources
    • Q&A
  • Customer Satisfaction Measures and Data Sources
  • Agency/Contractor Measures and Data Sources
    • Q&A


slide 3

Work Zone Performance Measures

Metrics that help to quantify how work zones impact travelers, residents, businesses and workers.

  • Project-level metrics
  • Agency program-level metrics


slide 4

Work Zone Performance Measurement

  • Quantifying work zone impacts
  • Manage work zone impacts
  • Guides investment decisions
  • Identify trends
  • Refine policies and procedures
  • Assists in public information and outreach


slide 5

Work Zone Safety and Mobility

23 CFR 630.1088(c)

  • States shall use field observations, available work zone crash data, and operational information to manage work zone impacts for specific projects during implementation.
  • States shall continually pursue improvement of work zone safety and mobility by analyzing work zone crash and operational data from multiple projects to improve State processes and procedures.
Rule on Work Zone Safety and Mobility icon.


slide 6

Work Zone Performance Measurement Challenges

  • Which measures are most important?
  • What data are needed?
  • Where and how do we get that data?
    • What is available/accessible?
    • How applicable is it?
  • How do we compute the measures from that data?
A photo of a traffic control room (source: TTI) and a photo of a computer monitor depicting a data chart.


slide 7

Guidance Development Process

  • Initial list of 13 possible measurement categories
  • Reduced and collated along three key dimensions
  • Practitioner expert panel identified and prioritized performance measures for each category/dimension


slide 8

Performance Measure Data Needs

  • Performance data
    • Quantifies the amount of the effects
    • Dimensions: mobility, safety, customer satisfaction, and agency/contractor productivity
  • Exposure data
    • Quantifies who or what was affected
    • Dimensions: counts, distances traveled, durations
  • Indicator data
    • Specifies activities, phases, time periods, or events of interest when effects occurred


slide 9

Performance Measure Selection

Step 1. Determine performance measurement categories of interest

Step 2. Decide which work zones to measure

Step 3. Decide what work zone conditions to measure

Step 4. Determine data sources to use

Step 5. Compute specific measures of interest


slide 10

Where Can We Get Data?

  • Extract it from existing sources
  • Collect it (manually, electronically)
  • Interpolate it from existing or collected data


slide 11

Guidance Document Structure

  • Introduction
  • Selecting Useful Performance Measures
  • Data Sources/Methods
    • Mobility-related Performance Measures
    • Safety-related Performance Measures
    • Customer Satisfaction-related Performance Measures
    • Customer Satisfaction-related Performance Measures
Screenshot of the report entitled 'Data Needs, Availability and Opportunities for Work Zone Performance Measures.'


slide 12

Mobility-Related Performance Measures

  • Mobility impacts commonly measured as
    • Throughput
    • Delays
    • Travel times
    • Travel time reliability
    • Vehicle queues


slide 13

Throughput

  • Existing Agency Data Sources
    • TOC or traffic signal system vehicle count data
    • Toll facility usage data
    • Automatic traffic recording (ATR) station data
    • Planning and programming AADT estimates
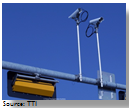
Cameras mounted above a signal head at an intersection. Source: TTI
  • Work Zone Specific Throughput Data
    • Data from work zone ITS deployment
    • Temporary mechanical data collection device
    • Manual vehicle count at key times & locations
  • Person Throughput Data
    • Manual sampling of per-vehicle occupancy levels
    • Manual sampling or video detection of pedestrian throughput
A construction worker wiring a data collection device. Source: TTI


slide 14

Throughput

  • Potential Future Data Source
    • Connected vehicle technology
      To be useful, sufficient market penetration of V2V and V2I technology is needed

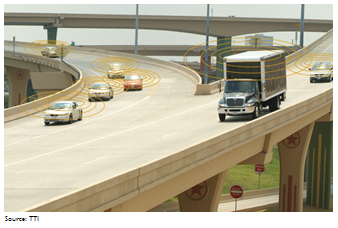
Merging traffic on an insterstate flyover. Each vehicle has several rings around it, indicating that the vehicles are transmitting information about their location and speed so they can avoid each other. Source: TTI


slide 15

Throughput

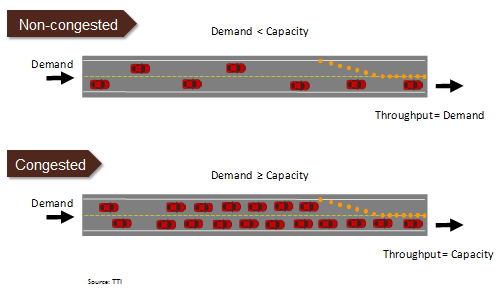
Graphic depicts an approach to a work zone under non-congested and congested scenarios. In the non-congested scenario, capacity is greater than demand and demand equals throughput. In the congested scenario, capacity is less than or equal to demand, and throughput equals capacity.


slide 16

Considerations and Trade-Offs of Throughput Data Sources

Data Source Key Considerations and Trade-offs
All data types
  • Depending on collection location, data is demand or throughput
  • Multiple days of data is needed to reduce day-to-day variations
TOC sensor data and toll facility usage data
  • Important to verify data availability once work has started
ATR station data
  • Need to verify that counts are "true" values (not adjusted)
Agency AADT estimates
  • Reasonable when capacity < demand at any time during the day
  • If diversion occurs, AADT overestimates throughput and exposure
Work Zone ITS data
  • Data must be archived and available for PM computations
Mechanical counters or manual counts
  • May not be practical for high-volume, high-speed roadways
  • Manual counts are labor intensive
Manual collection of person/vehicle occupancy levels
  • Useful if "green" and HOV travel is part of the WZ management plan
Manual or electronic collection of pedestrian throughput
  • Useful if "green" and HOV travel is part of the WZ management plan
  • Pedestrian and vehicle traffic peak hours may not always coincide
Connected vehicle data
  • Date of availability still uncertain


slide 17

Delay, Travel Time, Travel Time Reliability

  • Existing Agency Data Sources
    • TOC spot speed sensor data
    • TOC tracking of vehicles through use of cameras
    • TOC point-to-point travel time data using AVI, AVL, or license-plate recognition technology
  • Work Zone Specific Travel Time and Delay Data
    • Data extracted from a work zone ITS deployment
    • Portable point-to-point travel time data collection devices
    • Manual spot speed sampling using radar or lidar devices
    • Travel time runs through the work zone
    • Estimation of travel time delays from observed queue length data
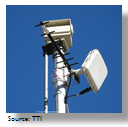
A post-mounted sensor. Source: TTI


slide 18

Delay Estimation from Observed Queue
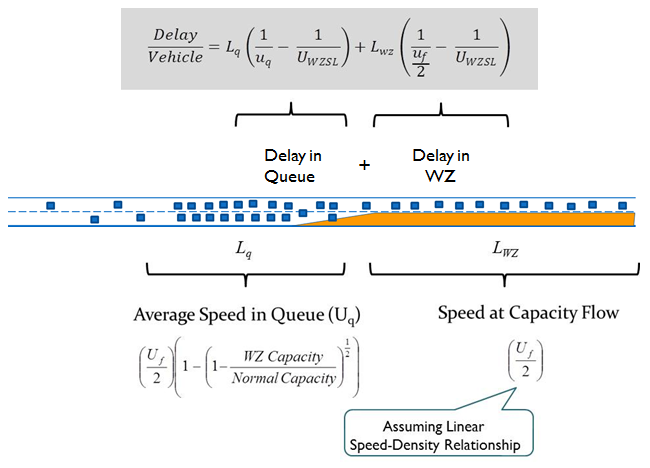
Equation and diagram depicting the means of estimating delay from the observed queue.


slide 19

Delay, Travel Time, Travel Time Reliability

  • Potential Future Data Source
    • Travel Times from Bluetooth Address Matching
      • Several states (e.g., Texas, Indiana) have used anonymous matching of Bluetooth devices in vehicles to track point-to-point travel times in work zones.
    • Private (3rd Party) Sources of Travel Time and Speed Data
      • The Virginia Department of Transportation examined the potential of obtaining historical private-sector traffic data for the purposes of computing work zone performance metrics
    • Connected vehicle technology
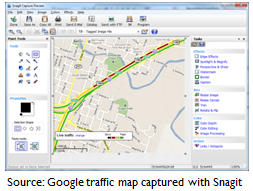
A rural arterial running in parallel to a highway. Source: TTI  Screenshot of a Google traffic map. Source: Google traffic map captured with Snagit.


slide 20

Example: Work Zone Delay Estimation from Bluetooth Address Matching
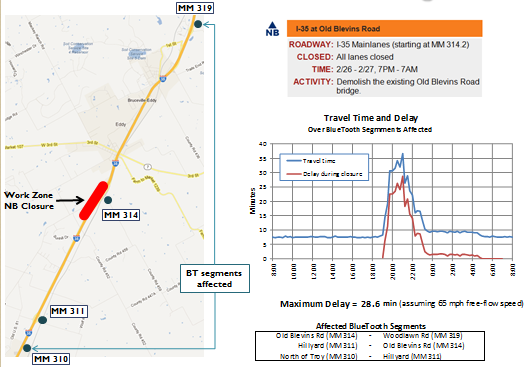
Combination of images including a map of the work area at I-35 and Old Blevins road; details of the closure duration, location, and type of activity (bridge demolition); a chart depicting travel time and delay (with a maximum delay of 28.6 minutes); and identification of the affected BlueTooth segments.


slide 21

Example: Corridor Delay Estimation from Bluetooth Address Matching
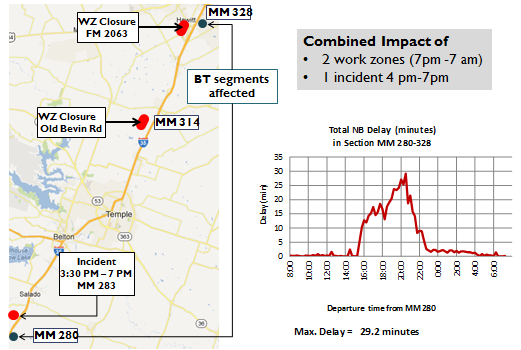
Combination of images including a map of the work area at I-35 and Old Blevins road as well as a second work zone at Hewitt; a note indicating that the combined impact was a result of two work zones and one incient; and a chart depicting travel time and delay (with a maximum delay of 29.2 minutes).


slide 22

Considerations and Trade-Offs of Delay, Travel Time, and Reliability Data Sources

Data Source Key Considerations and Trade-offs
TOC spot speed sensor data
  • Tend to be less accurate when congestion is present
  • Important to verify data availability once work has started
TOC point-to-point travel time data
  • Important to verify data availability once work has started
  • Accuracy depends on market penetration of tracking technology
  • Represents recently completed, rather than current, trip times.
Work zone ITS data
  • Data must be archived and available for PM computations
Portable point-to-point travel time data collection
  • Accuracy depends on market penetration of tracking technology
  • Represents recently completed, rather than current, trip times.
Manual spot-speed data
  • Labor intensive
  • Most useful if work zone impacts occur in a fairly small section
  • Most useful for assessing short time periods
Manual travel time data collection by driving through the work zone
  • Labor intensive
  • Most useful for assessing short time periods
  • Multiple runs increase accuracy & precision of travel time estimates
3rd party (private-sector) travel time and speed data
  • Level of detail available may vary by vendor
  • Translation to agencies' data mapping protocol is needed
Bluetooth data
  • Accuracy depends on market penetration of Bluetooth technology
  • Represents recently completed, rather than current, trip times.
Connected vehicle data
  • Date of availability still uncertain


slide 23

Traffic Queue Data Sources

  • Existing Data Sources
    • Speed data extracted from a work zone ITS deployment
    • Observation of queues from a permanent or work zone TOC
    • Observation of queues by field personnel at the work zone
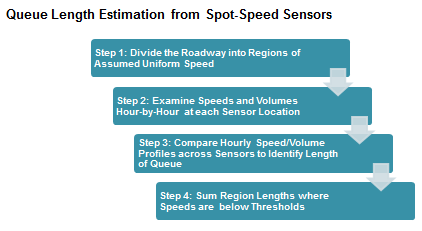
Queue length estimation from spot speed sensors comprises four steps: 1. Divide the roadway into regions of assumed uniform speed. 2. Examine speeds and volumes hour-by-hour at each sensor location. 3. Compare hourly speed/volume profiles across sensors to identify length of queue. 4. Sum region lengths where speeds are below thresholds.


slide 24

Queue Estimation

Example:

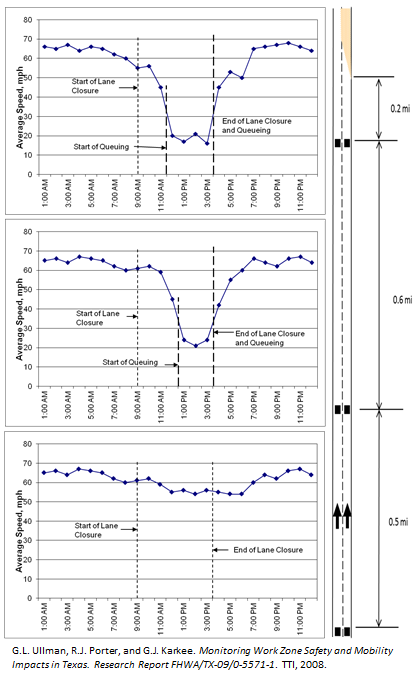
  • Spot traffic sensors are located 0.2 mile, 0.8 mile, and 1.3 miles upstream of the temporary lane closure.
  • Project diary information indicates that a lane closure began at 9:00 AM and ended at 3:30 PM.
Time Estimated Location of Upstream End of Queue Estimated Queue Length
11:00 AM None 0
12:00 PM Between Sensors 1 & 2 0.2 + (0.6/2) = 0.5 mile
1:00 PM Between Sensors 2 & 3 0.2 + 0.6 + (0.5/2) = 1.05 mile
2:00 PM Between Sensors 2 & 3 1.05 mile
3:00 PM Between Sensors 2 & 3 1.05 mile
4:00 PM None 0

Series of three charts that provide average speeds over time for three separate but contiguous road segments, including changes in speed when lane closures decrease average speed and openings restore normal speeds. Source: G.L. Ullman, R.J. Porter, and G.J. Karkee, Monitoring Work Zone Safety and Mobility Impacts in Texas, Research Report FHWA/TX-09/0-5571-1, TTI, 2008.


slide 25

Traffic Queue Data Sources

  • Potential Future Data Source
    • Screenshot Captures from 3rd Party Traveler Information Providers
    • Private (3rd Party) Sources of Travel Time and Speed Data
    • Connected vehicle technology
Merging traffic on an insterstate flyover. Each vehicle has several rings around it, indicating that the vehicles are transmitting information about their location and speed so they can avoid each other. Source: TTI Screenshot of a Google traffic map from a third party traveler information provider. Source: Google traffic map captured with Snagit.


slide 26

Considerations and Trade-Offs of Traffic Queue Data Sources

Data Source Key Considerations and Trade-offs
All data types
  • Definition of queues (e.g., min speed threshold) is critical
  • Both queue duration and queue length over time are important
TOC or work zone ITS data using spot speed sensors
  • Requires detailed speed data analysis on sensor by sensor basis
  • Important to verify data availability once work has started
Visual queue identification by TOC operators
  • Requires adequate camera coverage upstream of work zone
Collection of queue data by field personnel
  • Data collection protocol training is needed
  • May be difficult to accurately monitor the end of queue
  • Ensure that field personnel understands its importance
Screenshot of real-time traffic condition maps
  • Required screen resolution depends on max. expected queue length
  • Time-lapse capabilities do not exist in most screen capture software.
3rd party traveler information data
  • Level of detail available may vary by vendor
  • Translation to agencies' data mapping protocol is needed
Connected vehicle data
  • Date of availability still uncertain


slide 27

Identifying and Computing Specific Mobility Measures of Interest

Once work zone mobility-related data sources are identified, a jurisdiction will have to make its own decisions as to what performance measures it chooses to track.

  • Example: In some jurisdictions with TOCs, efforts are underway to develop simple-to-use computer dashboards that can provide current traffic conditions in and around a work zone
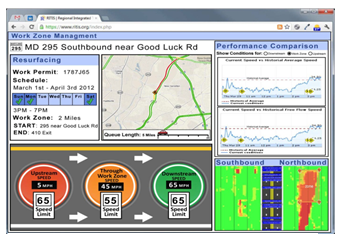
Screenshot of a RITIS dashboard. Source: Paracha, J. Work Zone Performance Measurement using Probe Data.  Presentation of Maryland Work Zone Performance Measurement Project.


slide 28

Q&A


slide 29

Safety-Related Performance Measures

  • Safety impacts commonly measured as
    • Crashes
    • Safety Surrogates
    • Worker Accidents


slide 30

Crashes

  • Existing Agency Data Sources
    • Statewide traffic crash records database entries
    • Crash report forms (hard-copy or electronic)
    • TOC incident database entries
    • Emergency response/service patrol dispatch logs
  • Future Sources
    • Agency-collected work zone crash information
    • Connected vehicle initiative data
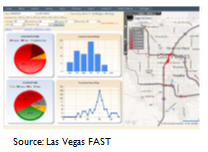
Screencapture of a series of data charts and a map on a computer screen. Source: Las Vegas FAST


slide 31

Considerations and Key Trade-offs

Data Source Key Considerations and Trade-offs
Statewide Crash Records Database
  • Limited work zone features and activities information
  • Time lags in obtaining crash data for a given work zone
Electronic or hard copy crash report forms
  • Limited work zone features and activities information
  • Requires manual coding
  • May need to work with multiple enforcement agencies
TOC operator incident logs
  • Includes non-reported as well as reported crashes
  • Includes non-crash events
Dispatch Logs of Emergency Response or Service Patrols
  • Likely to include non-traffic crash events as well
  • Potential privacy concerns
Agency-collected crash and work zone database
  • Significant agency effort required
  • Requires upper agency support and emphasis
Connected vehicle data
  • Date of availability still uncertain


slide 32

Safety Surrogates

  • Existing Agency Data Sources
    • Speed data collected by hand-held devices
    • Speed data extracted from ITS sensors
    • Travel times
    • Videotaped traffic behaviors at key locations
    • Work zone inspection scores
  • Future Sources
    • Microscopic traffic simulation output
    • Connected vehicle initiative data
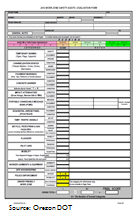
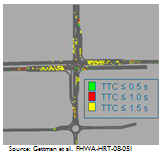
Screen capture of a work zone road safety inspection form. Source: Oregon DOT Screen capture from a microscopic traffic simulation output screen. Source: Gettman et al.  FHWA-HRT-08-051


slide 33

Considerations and Key Trade-offs

Data Source Key Considerations and Trade-offs
All data types
  • Correlation to crashes not yet fully verified
  • Most can be obtained relatively quickly
TOC or work zone ITS speed sensor data
  • Value of data depends on the locations of the sensors.
  • Need to verify data availability and archival once work starts
Speed data collected with hand-held radar or lidar
  • Data collection easy to accomplish
  • Useful for assessing speed behaviors
  • Inconspicuous data collection techniques required
Travel times through the work zone
  • Speed change locations can indicate problems
  • Can be used to assess compliance with wz speed limit
Videotaped traffic behavior
  • Can be difficult to find a unobtrusive viewing point
  • Data analysis is labor intensive
  • Requires precise definition of behaviors of interest
Work zone inspection scores
  • Requires significant effort to establish scoring/ratings
  • Correlation of scores to actual safety levels not yet verified
Traffic simulation output (analyzed with SSAM)
  • Significant coding and calibration effort required
  • Correlation to actual work zone safety conditions not yet verified
Connected vehicle data
  • Date of availability still uncertain


slide 34

Worker Accidents

  • Existing Agency Data Sources
    • Agency or contractor worker injury records
    • State worker compensation commission accident statistics
    • Bureau of Labor statistics database
  • Future Sources
    • Connected vehicle initiative data


slide 35

Key Considerations and Trade-offs

Data Source Key Considerations and Trade-offs
Agency or contractor worker injury records
  • Use must be monitored due to privacy concerns
  • Small sample size for many companies will make it difficult to identify trends
State worker compensation commission statistics
  • Useful for comparisons to agency or contractor accident trends
  • Level of detail will be limited
BLS, OSHA worker accident statistics
  • Useful for comparisons to agency or contractor accident trends
  • Level of detail will be limited
Agency-collected work zone crash and accident database
  • Significant effort required
  • Requires upper agency support and emphasis
  • Use of accident reports must be monitored carefully due to privacy concerns


slide 36

Identifying/Computing High Priority Safety Measures

  • Change in crash frequency (by type)
  • Change in crash rate per vehicle-miles-traveled (for a given time period)
  • Compliance with work zone speed limit
  • Speed variance at a location
  • Frequency of worker accidents
  • Worker injury rate per hours worked
  • Injury type, severity, contributing factor distributions


slide 37

Example: Tracking Crash Frequency Trends at a Work Zone

  • Work zone on roadway that normally experiences 5 crashes per month
  • Have had 7, 3, 10, 7 crashes in past 4 months during work zone
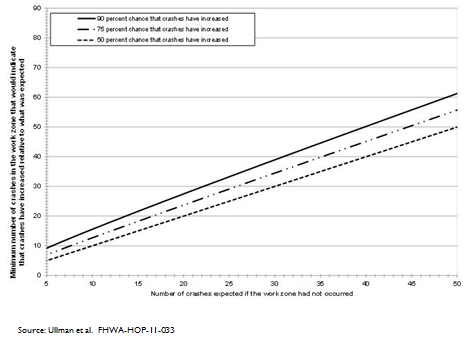
Chart plotting the number of accidents that occurred in a work zone versus the number that would have occurred had there been no work zone. Source: Ullman et al.  FHWA-HOP-11-033


slide 38

Example: Tracking Crash Frequency Trends at a Work Zone
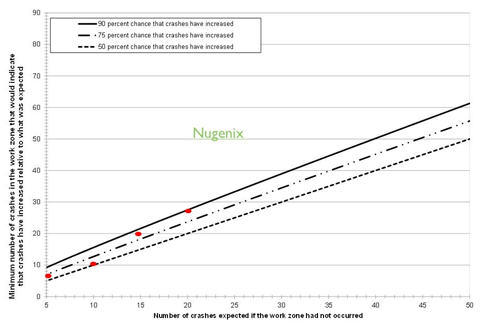
Chart plotting the number of accidents that occurred in a work zone versus the number that would have occurred had there been no work zone. Red dots appear along the trend line and the word Nugenix is in the middle of the chart. Source: Ullman et al.  FHWA-HOP-11-033


slide 39

Q&A


slide 40

Customer Satisfaction Performance Measures

  • Who are our customers?
    • Travelers, residents, and businesses
  • Impact of Work Zones?
    • Delays, congestion, and inconveniences are challenging for maintaining good relationships with customers
  • Why are measures necessary?
    • Infrastructure is largely publicly-owned and funded

Therefore...

Measuring customer satisfaction associated with work zones is critical to an agency's or contractor's set of work zone performance measures


slide 41

Existing Customer Satisfaction Data Sources (1 of 3)

  • Focus Group Transcripts
    • Participants opinions, experiences, and suggestions
    • Not representative of overall driving population
    • Anecdotal findings
  • In-Person or Telephone Interview Responses
    • Responses may vary at location over time
    • In-person interviews require short surveys
    • Fairly labor intensive to administer


slide 42

Customer Satisfaction Data Example
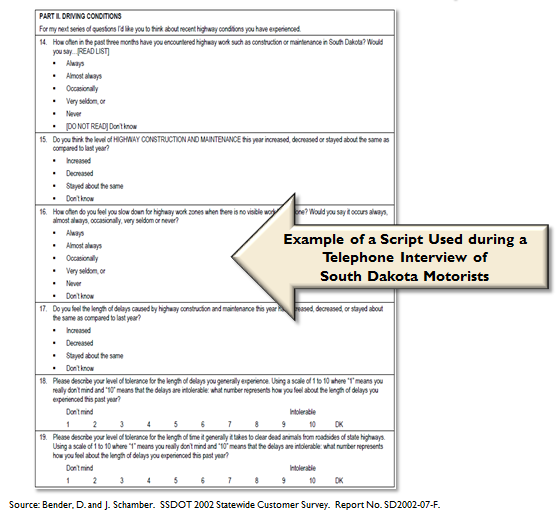
Example of a script used during a telephone interview of South Dakota motorists. Source: Bender, D. and J. Schamber.  SSDOT 2002 Statewide Customer Survey.  Report No. SD2002-07-F.


slide 43

Existing Customer Satisfaction Data Sources (2 of 3)

  • Mail, Email, or Website Survey Responses
    • Quantitative statistical analysis
    • Qualitative assessments
    • Predetermined options
    • Statistically significant findings
    • High cost
    • Slight negative bias


slide 44

Customer Satisfaction Data Example
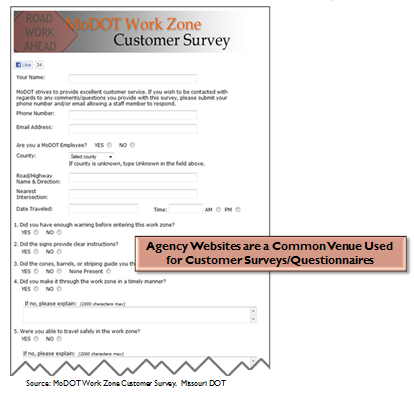
Clip of the MoDOT Work Zone Customer Survey. A note advises that Agency Websites are a Common Venue Used for Customer Surveys/Questionnaires. Source: MoDOT Work Zone Customer Survey.  Missouri DOT.


slide 45

Existing Customer Satisfaction Data Sources (3 of 3)

  • Customer complaint database entries
  • Databases track complaint arrivals and disposition
  • Some complaints easily associated with a work zone
  • Some complaints may be more indirect
  • Complaints effective for identifying operational or safety problems
  • Not indicative of overall driver satisfaction
  • Small sample sizes

Travelers, residents, or nearby businesses may embellish conditions somewhat when making a work zone-related complaint

Those who are not unhappy generally do not contact the agency to indicate their general satisfaction


slide 46

Future Customer Satisfaction Data Sources

  • Social Media Technologies
    • Facebook
    • Twitter
    • Selection biases and similar traditional survey techniques issues
    • Responses negatively skewed
Facebook and Twitter icons
  • Web-Based Tools to Conduct On-Line Focus Groups
    • System capabilities may include:
      • Polling group
      • Private chat sessions
      • "Groupthink" area
Logo for e-FocusGroups, a focus group service provider.


slide 47

Considerations and Trade-Offs of Customer Satisfaction Data Sources

Data Source Key Considerations and Trade-Offs
Focus groups
  • Best for gathering opinions, perceptions
  • A properly trained facilitator is critical
  • Data from multiple groups may be needed
One-on-One Interviews
  • Best for obtaining responses during or right after drivers have passed through a work zone
  • May need to do surveys multiple times as conditions in the work zone change
Surveys/ Questionnaires
  • Multiple dissemination mechanisms (mail, email, website) possible
  • Potential to reach a larger sample size more efficiently
  • Properly designed surveys can yield statistically significant results
Complaints
  • Work zone effects may trigger complaints directly or indirectly
  • Customers may embellish the magnitude of the problem
  • Statistical analyses are usually not possible with the data
Social Media Uses
  • Important to rely on trained survey designers for these applications
  • Responses will be biased towards younger, more technology-savvy users
On-Line Focus Groups
  • Allows participants to remain at their computers to participate
  • Effectiveness of on-line efforts to mimic the interactions that occur in face-to-face focus groups is unknown


slide 48

Identifying/Computing High Priority Customer Satisfaction Measures

  • Ratings of the quality of work zone features seen while driving through a work zone
    • Signs
    • Information provided regarding delays, queues, work activities
  • Satisfaction ratings with travel conditions through multiple work zones
    • Multiple work zones
    • Corridor in a region or network
  • Frequency/rate of complaints
  • Satisfaction ratings for traveling through work zone


slide 49

Agency/Contractor Productivity Performance Measures

  • Existing Agency Data Sources
    • Construction management system databases
    • Lane closure request/approval databases
    • Daily project diary notes
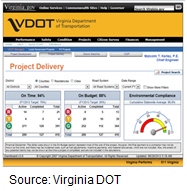
Screenshot of a Virginia DOT project dashboard.
  • Future Sources
    • Mobile data collection applications of work activities
    • Electronic maintenance work databases
A smart phone.


slide 50

Key Considerations and Trade-Offs

Data Source Key Considerations and Trade-offs
Construction management system databases
  • Focus mainly on contract-related data
  • Data elements of interest are often narratives in the system, with minimal consistency in entries across projects
Lane closure request and approval databases
  • May include closures across multiple agencies and contractors
  • Normally limited to high-volume roadways only
  • May contain a large number of "phantom" closures that need to be removed prior to analyses
Daily project diaries
  • Amount and type of data entered often varies by project
Mobile applications for project activity entry
  • Use of mobile devices in the field may cause costs and durability of the devices to become an issue
  • An application of this type may not yet exist
Maintenance management system databases
  • Requires detailed recordkeeping of activities by all maintenance crews and crew members


slide 51

Identifying/Computing High Priority Agency/Contractor Productivity and Efficiency Performance Measures

  • % of allowable or total days worked
  • % of lane closure hours occurring outside of allowable "work windows"
  • Production rates


slide 52

Resources

  • Guidance on Data Needs, Availability, and Opportunities for Work Zone Performance Measures
  • A Primer on Work Zone Safety and Mobility Performance Measurement
  • Work Zone Performance Measures Pilot Test
  • Domestic Scan on Work Zone Assessment, Data Collection, and Performance Measurement

Available at http://www.ops.fhwa.dot.gov/wz/decision_support/performance-development.htm


slide 53

Q & A


Office of Operations