Anderson Junction to Black Ridge
slide 1
CA4PRS Case Study
Cameron Kergaye, PhD, PE – UDOT
Brad Lucas, PE, PTOE – UDOT
Troy Torgersen, PE – UDOT
Eric Malmberg, PE – Wilson & Company
View the PDF
Version [2.9 MB]
![]() You will need the Adobe
Reader to view the PDFs on this page.
You will need the Adobe
Reader to view the PDFs on this page.
slide 2
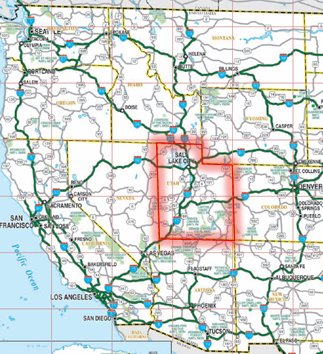
Project Location
- Southwest Utah
- 21 miles N of St. George, UT
- 141 miles NE of Las Vegas, NV
- Between Milepost 27 & 34
slide 3
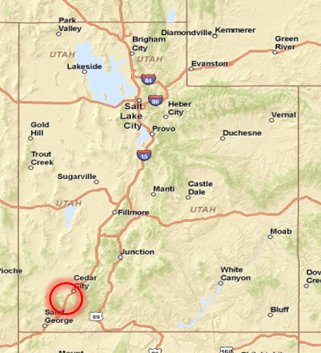
Project Location
- Southwest Utah
- 21 miles N of St. George, UT
- 141 miles NE of Las Vegas, NV
- Between Milepost 27 & 34
slide 4
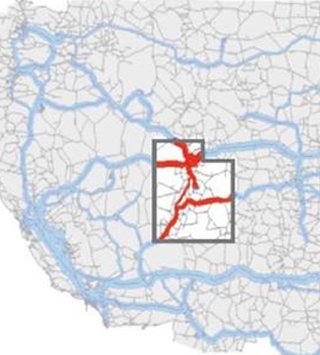
Project Location
- Primary Freight Corridor
- 2500+ Trucks per day
- 21% to 33% Truck Traffic
slide 5
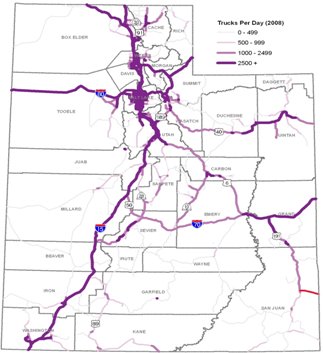
Project Location
- Primary Freight Corridor
- 2500+ Trucks per day
- 21% to 33% Truck Traffic
slide 6
Existing Roadway Characteristics
slide 7
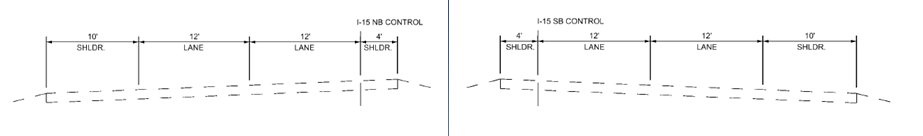
Existing Roadway Characteristics
- Rural two-lane freeway with variable width median
- Two 12 ft lanes in each direction
- 4 ft left shoulders and 10 ft right shoulders
slide 8
Existing Roadway Characteristics
- Asphalt Pavement
- Rolling to Mountainous terrain with grades between 3% - 6%
- 4 – Interchange Structures within project limits
slide 9
Proposed Pavement Rehabilitation
- 2" Mill
- 3" Cold-in-place recycle
- 1 ½" HMA
- 1 ½" SMA
slide 10
Proposed Pavement Rehabilitation
- Dig out and replace 15" of asphalt at existing structures to meet AASHTO vertical clearance at underpass structures
- Improve ramp geometry and lengths
- Construction Schedule: (between June and October 2010)
slide 11
Existing Traffic Conditions
- AADT ≈ 21,760 (2009)
- 21% Trucks (4% single & 17% Combo Trucks)
- Monthly Hourly Traffic Reports obtained from UDOT (2009)
- Three months selected for Traffic Pattern Comparison (April, August, & October)
slide 12
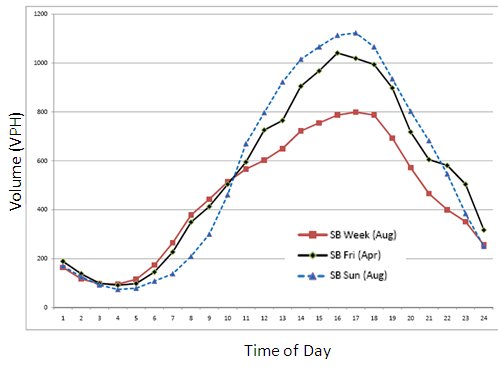
Existing Traffic Conditions Southbound
slide 13
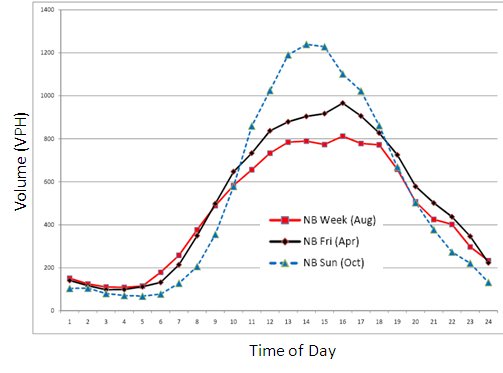
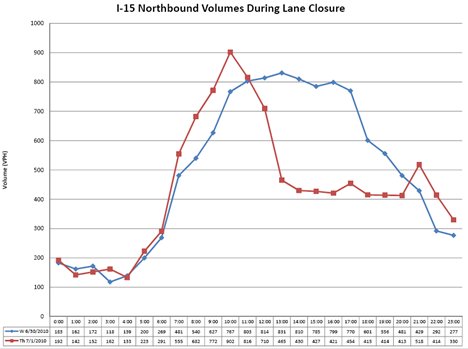
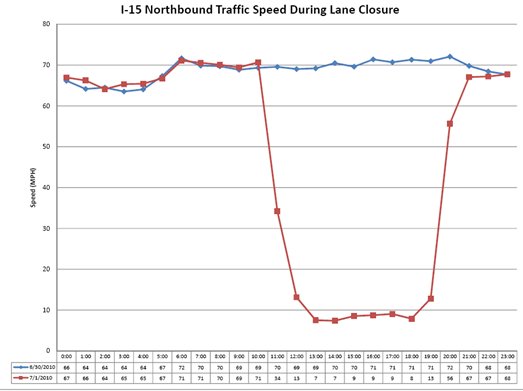
Existing Traffic Conditions Northbound
slide 14
Goals and Objectives for using CA4PRS
- Compare construction strategies to optimize staging plans
- Reduce construction schedule
- Develop less disruptive lane closure schemes and traffic management plans
- Minimize total project cost
slide 15
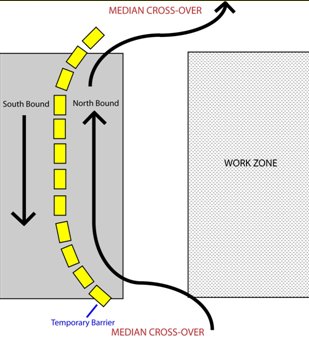
Construction Alternatives
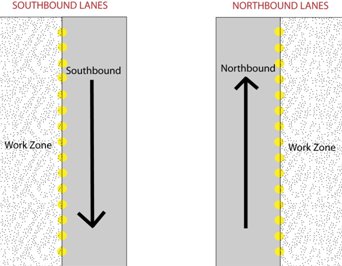
- Median Crossover Closure
slide 16
Construction Alternatives
- Median Crossover Closure
- 24/6 Closure (Open on Sundays)
slide 17
Construction Alternatives
- Median Crossover Closure
- 24/6 Closure (Open on Sundays)
- Nighttime Closure (7pm to 5 am)
slide 18
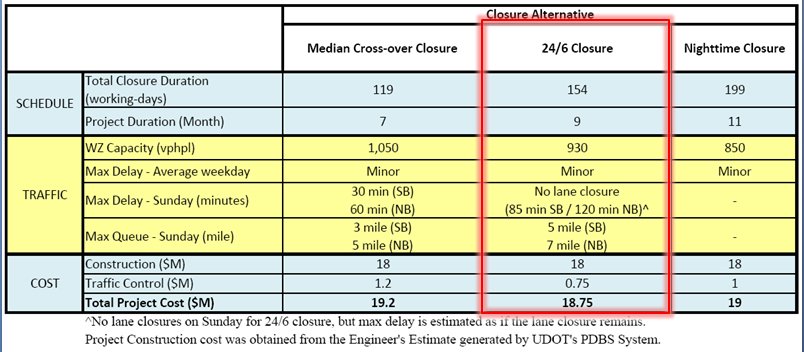
Summary of CA4PRS Analysis Results
slide 19
Summary of CA4PRS Analysis Results
- CA4PRS indicated that the Median Crossover closure alternative provides the shortest project construction Schedule but not necessarily the least impacts to traffic. Also, the Road User Cost and Total Project Costs were higher given the extra traffic control costs and expenses to build the crossovers.
- CA4PRS indicated that both the 24/6 closure alternative and the Nighttime Closure Alternative minimized work zone traffic delay and lowered the road user cost and traffic control costs.
slide 20
Observations
- During Peak hours, actual delays & queues were larger than predicted
slide 21
Observations
- During Peak hours, actual delays & queues were larger than predicted
slide 22
Observations
- During Peak hours, actual delays & queues were larger than predicted
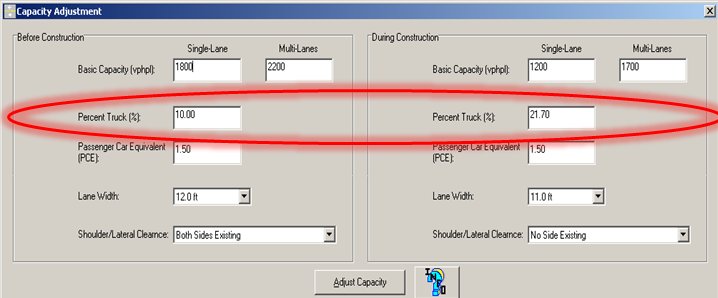
- Unexpected results came from errors in data entry
- Percentage of Truck Traffic (2009 data shows ≈ 21% ; actually observed closer to 33% or higher)
- Unexpected results came from errors in data entry
slide 23
Observations
- During Peak hours, actual delays & queues were larger than predicted
- Unexpected results came from errors in data entry
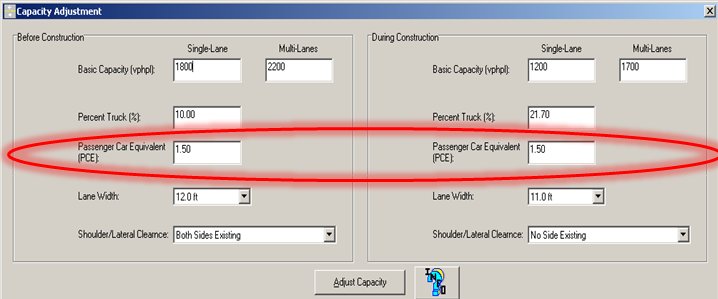
- Factor for Passenger Car Equivalent (Level= 1.5, Rolling =2.5, or Mountainous Terrain = 4.5)
- Unexpected results came from errors in data entry
slide 24
- During Peak hours, actual delays & queues were larger than predicted
- Unexpected results came from errors in data entry
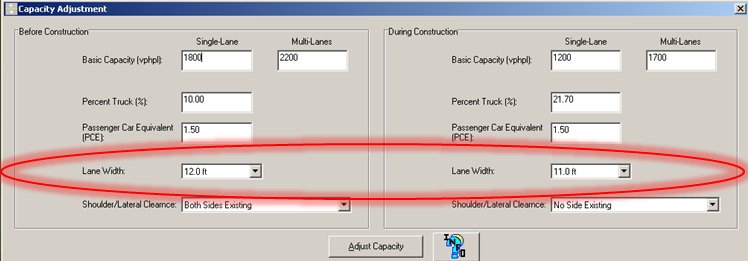
- Traffic Control setup (10 ft lanes with no shoulders)
- Unexpected results came from errors in data entry
slide 25
Observations
- During Peak hours, actual delays & queues were larger than predicted
- Unexpected results came from errors in data entry
- Police activity and speed enforcement impeded traffic
- Unexpected results came from errors in data entry
slide 26
Observations
- During Peak hours, actual delays & queues were larger than predicted
- Unexpected results came from errors in data entry
- Lengths of contractor operations adjacent to traffic was a distraction to drivers
- Unexpected results came from errors in data entry
slide 27
Observations
- During Peak hours, actual delays & queues were larger than predicted
- Unexpected results came from errors in data entry
- Factor for Passenger Car Equivalent (Level= 1.5, Rolling =2.5, or Mountainous Terrain = 4.5)
- Percentage of Truck Traffic (2009 data shows & 21% ; observed closer to 33% or higher)
- Traffic Control setup (10 ft lanes with no shoulders)
- Police activity and speed enforcement impeded traffic
- Lengths of contractor operations adjacent to traffic was a distraction to drivers
- Unexpected results came from errors in data entry
slide 28
Observations
- During Peak hours, actual delays & queues were larger than predicted
- Unexpected results came from errors in data entry
- When the data was entered correctly, the calculated results better reflected the observed conditions
slide 29
Lessons Learned
- Avoid exceeding capacity by using a factor of safety
- Develop support from DOT management regarding implementation of CA4PRS recommendations
- Use detailed and relevant traffic data for input variables
- Use Real-Time data to make adjustments
- Consider a Performance Based Work-Zone specification
- Listen to the recommendations of the Resident Engineer for paving operations
slide 30
Conclusions
- CA4PRS results and recommendations were useful when the program is used correctly.
- Be sure to evaluate the project entirely and consider even minor factors to be relevant and influential.
- Develop confidence and familiarity in the use of the CA4PRS program.