Overview of Work Zone ITS
slide 1: Overview of Work Zone ITS
Tracy Scriba
FHWA
May 21, 2013
Bettendorf, Iowa
slide notes:
None
slide 2: Presentation Outline
|
 |
slide notes:
None
slide 3: What is Work Zone ITS?
- Use of technology to support effective work zone management and operations
- Used both in and around work zones
- Can have a safety or mobility focus, but often supports both
- Portable and temporary in most cases
- May be leased or purchased
slide notes:
Smart work zones are usually Portable and Temporary, lasting last the duration of the road improvement project and then being moved to other road project work zones over time or returned to the vendor.
However, in some situations the systems can be Fixed, for example when part or all of a multi–year work zone ITS deployment is left in place and incorporated into permanent traffic monitoring and management systems.
slide 4: What is Work Zone ITS?
- Use of technology and data to support effective work zone management and operations
- Used both in and around work zones
- Can have a safety or mobility or customer satisfaction focus, but often supports all 3
- Has portable and temporary components in most cases that may be combined with permanent
- May be leased or purchased or acquired indirectly
slide notes:
Smart work zones are usually Portable and Temporary, lasting last the duration of the road improvement project and then being moved to other road project work zones over time or returned to the vendor.
However, in some situations the systems can be Fixed, for example when part or all of a multi–year work zone ITS deployment is left in place and incorporated into permanent traffic monitoring and management systems.
slide 5: WZ ITS Components
|
  |
slide notes:
None
slide 6: History
- Handful of companies, each with one to a few products
- Products tended to be systems → Not very flexible
- Each deployment an adventure/experiment
- Lots of learning
- Not enough thought into systems
- As many failures as successes
slide notes:
None
slide 7: WZ ITS Has Evolved
- Broader range of products and technologies
- More scalable and flexible
- Better planned (usually)
- More applications
- Leveraging of permanent ITS
- Sometimes accomplished by purchasing data
- Less adventure
- More successes
slide notes:
None
slide 8: Why Use Work Zone ITS?
|
 |
slide notes:
More Congestion on Our Roads
- From 1980 to 2001, vehicle miles traveled increased 82 percent while miles of public roads increased only 4 percent.
- We are traveling more miles. We have a limited amount of new roads. The result is more congestion.
- Work zones are estimated to account for 24% of non–recurring congestion. (ORNL study)
More Lost Lives
- The safety of road construction workers and the traveling public are of great concern. The overall number of work zone fatalities have been rising over the last few years after a downward trend; we are not sure how the rate has changed. In 2002, 1,181 fatalities resulted from motor vehicle crashes in work zones. (FARS)
- Note that of the 120 to 130 workers killed per year, nearly two–thirds (62%) of the deaths are not directly related to traffic issues. This means that they are not the direct result of traffic passing through the work zone. These fatalities may be directly related to other work zone factors such as the work zone geometry that may affect worker safety by confining the work space and creating unsafe traffic patterns for construction equipment within the work zone.
Growing Exposure
- A growing portion of roadwork is done under traffic on existing roads. The share of capital funds used for system preservation rose from 47.6 percent in 1997 to 52.0 percent in 2000. (2002 Status of the Nation's Highways, Bridges, and Transit: Conditions & Performance, U.S. DOT, FHWA–PL–03–004)
slide 9: WZ Challenges and ITS
- Congestion
- End–of–queue crashes
- Delay
- Dissatisfied motorists (private & commercial)
- Difficulty in emergency vehicle access and response
- Delayed contractor vehicle access (reduced efficiency)
- Speed detection and warning systems
- Traveler information systems, active diversion
- Data on best times to work and for deliveries
slide notes:
None
slide 10: WZ Challenges and ITS
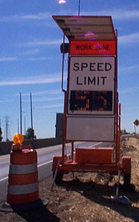
- Speeding/Speed Management
- Setting speed limits
- Compliance with speed limits
- Limited areas for law enforcement officer stationing
- Limited areas to pullover speeders
- Speed monitoring systems
- Variable speed limit systems
- Automated enforcement systems
slide notes:
None
slide 11: WZ Challenges and ITS
- Crashes
- Timeliness of incident detection and response
- Congestion
- Secondary crashes
- Intrusions
- Work vehicle access/egress
- Cameras and queue detection systems
- Intrusion alarms
- Signs warning of entering/leaving roadway
slide notes:
None
slide 12: WZ Challenges and ITS
- Performance Monitoring
- Lack of data
- Limited personnel to gather data
- Difficulty in assessing impacts and estimating performance
- Unknowns about appropriate work windows
- Unknown effectiveness of WZ strategies
- Systems gather lots of data automatically (archiving)
- Exposure/volumes, travel speeds (delays, queues) can help assess impacts on conditions
- Determine best times to work
- Document effects of different WZ strategies
slide notes:
None
slide 13: How Does WZ ITS Fit In?
- WZ management strategies include:
- Project Coordination and Scheduling
- Contracting
- Construction Methods
- Transportation Management
- Public Information
- Need a combination of strategies
- Choose strategies to solve specific problems
- WZ ITS is one strategy in the toolbox
slide notes:
As I mentioned earlier, one of the goals of the updated Rule is to expand WZ impacts management beyond traffic control. Using scheduling, construction strategies, contracting strategies, transportation management strategies helps to improve safety, reduce traffic and mobility impacts, and promote coordination in and around the work zone. To encourage this broader thinking, one of the components of the updated Rule expands the existing requirement for developing a traffic control plan (TCP) for handling traffic at each work zone to now require the development and implementation of a transportation management plan (TMP) for road project.
TMPs present a more comprehensive approach to managing work zone safety and mobility. A TMP lays out a set of coordinated work zone management strategies and describes how they will be used to manage the work zone safety and mobility impacts of a road project. Transportation management strategies for a work zone include temporary traffic control measures and devices, operational strategies, and public information and outreach. WZ ITS can be used as an operational strategy and can be used for public information and outreach.
The thing to keep in mind is that WZ ITS is one possible strategy. Effective WZ management requires a combination of strategies. The best combination of work zone management strategies needs to be based on site–specific conditions and thus determined on a case–by–case basis. WZ ITS is sometimes deployed as a strategy without first clearly identifying what the problem is and whether ITS is the right solution for the problem.
slide 14: ITS Applications in Work Zones
|
 |
slide notes:
None
slide 15: Traffic Monitoring and Management
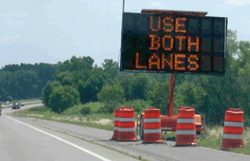
Dynamic Lane Merge Systems:
- Monitor traffic and regulate merging approaching lane closures
- Intended to smooth traffic flow and improve safety by increasing consistency in merge behavior
- Can be used to encourage early merge or late merge
slide notes:
None
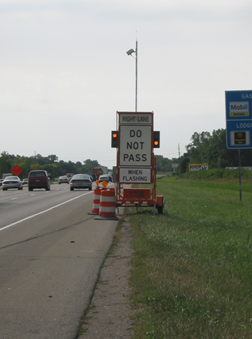
slide 16: Dynamic Early Merge System
Creates a dynamic no–passing zone based on detected traffic volume and back–ups
|
 |
slide notes:
None
slide 17: I–94 North of Detroit, Michigan
- Used to improve traffic flow, prevent dangerous merging
- System reduced travel time delays, number of crashes, aggressive driving during AM and PM peak periods
- Average travel speed increased from 40mph to 46 mph during morning peak period
|
 |
slide notes:
- Average morning peak period travel time delay decreased from 95 seconds per vehicle to approx 69 seconds per vehicle for every 10,000 feet of travel
- Average number of aggressive driving maneuvers pre travel time run decreased from 2.88 to 0.55 during the afternoon peak period and was relatively unchanged during the morning peak period.
- 4.3 months of construction without system had an average of 1.2 crashes per month; zero in the 2 months after the system was deployed
- MDOT observed better traffic flow and less queuing, leading to less speed variance
- Average speed increased from 40 mph to 46 mph during the morning peak period and was relatively unchanged during the afternoon peak period.
The installation of the DELMTCS is recommended on three–lane highways (in each direction), reduced to two–lanes (each direction) during construction according to the following volume guidelines, based on the pre–construction traffic volume conditions:
Peak Hourly Volumes Observed Prior to Construction
- Threshold Hourly Volume = 3,000 to 3,800 vehicles per hour per direction (two peak hours per day)
- Average Daily Traffic Volumes = 34,500 to 45,000 vehicles per day per direction
Installation of the DELMTCS should not be based on ADT volumes alone)
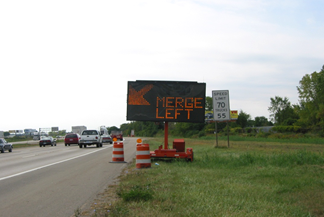
slide 18: Dynamic Late Merge – Minnesota
|
 |
slide notes:
None
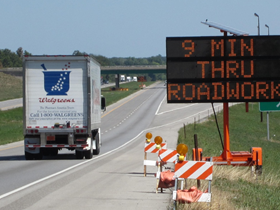
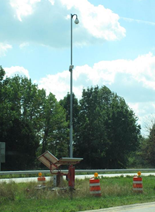
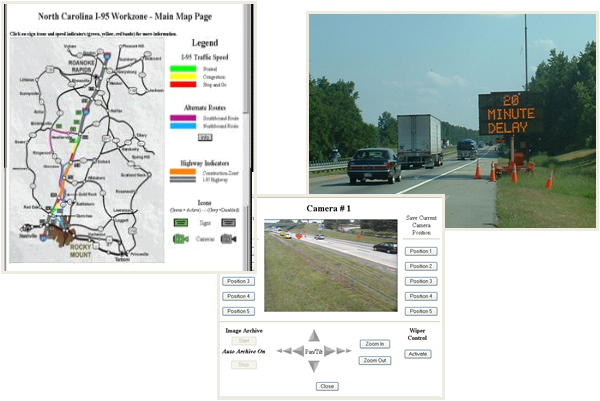
slide 19: Traveler Information
- Sensors to monitor real–time traffic conditions
- Data used to calculate delay/speed/travel time
- Info automatically displayed on CMS and website (map, CMS messages)
- Info can also be distributed via HAR
- Cameras to gather additional condition info
slide notes:
None
slide 20: Traveler Information
slide notes:
None
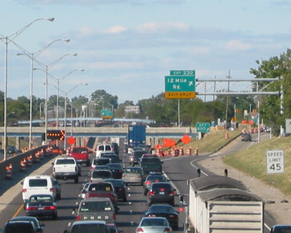
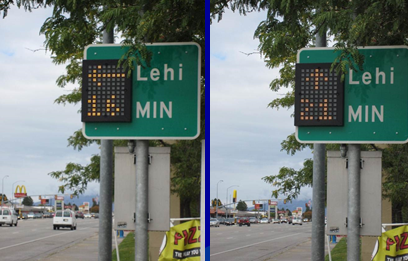
slide 21: ITS for Traffic Mgmt/Route Choice
- Provide travel times along arterial and Interstate
- Enable route choice
Sequencing Travel Time Sign on State Street Northbound
slide notes:
None
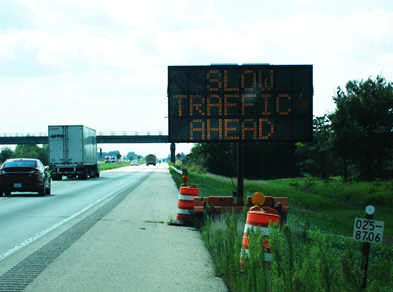
slide 22: ITS to Mitigate End–of–Queue Crashes
|
 |
slide notes:
None
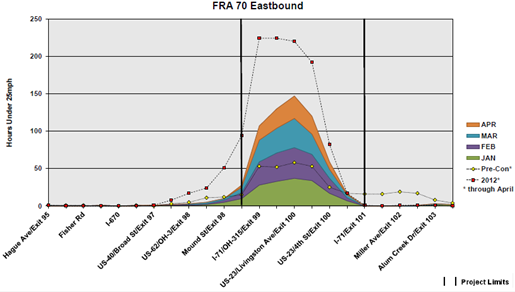
slide 23: ITS for Traffic Performance Spec
- Pilot of performance–based spec for delay
- Compared to usual prescriptive MOT spec
- ITS used to monitor traffic conditions and estimate delays – multiple routes, turning movements
- Similar results for both specs
- Prescriptive specification: $75k penalty
- Performance spec: $68–69k penalty
- Used data to relax some lane closure restrictions
slide notes:
None
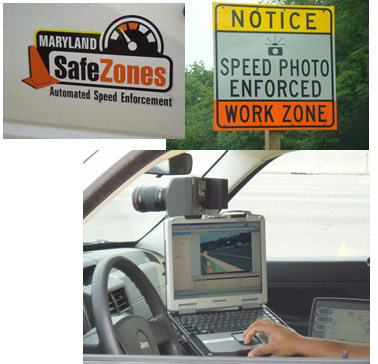
slide 24: Automated/Technology Assisted Enforcement
|
 |
slide notes:
None
slide 25: Performance Monitoring/Management
- Slightly historical Inrix Data
- Identify mobility issues, investigate in the field, make changes to address or notify drivers
slide notes:
None
slide 26: Las Vegas FAST for WZ Management
- Freeway and Arterial System for Transportation
- Multi–jurisdictional
- Las Vegas metro area freeways and many arterials
- Primary purpose: incident management
- Other uses include:
- WZ traffic management planning
- Data sharing, strategies
- WZ operations during construction
- Signal timing adjustments
- Traveler information: lane closures, delays
- WZ performance measurement
- WZ traffic management planning
slide notes:
None
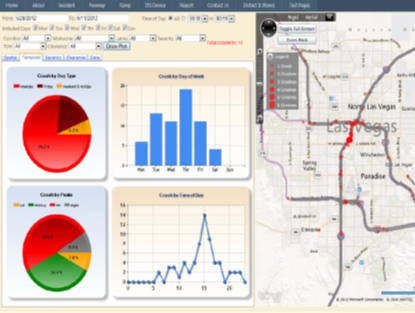
slide 27: Performance Monitoring Example
- Las Vegas FAST Crash Performance Dashboard
- Can be tailored by type of crash, including WZ
slide notes:
None
slide 28: FHWA ITS in WZ Efforts
|
 |
slide notes:
None
slide 29: WZ ITS Implementation Guide
- Help practitioners effectively use WZ ITS as one of many tools for WZ management
- Assessing the Need for WZ ITS
- Detailed System Planning and Design
- Procurement
- System Deployment
- System Operation and Maintenance
- Evaluation
slide notes:
None
slide 30: WZ ITS Case Studies
- Show how ITS can be used to address WZ safety and mobility issues
- Mitigating End–of–Queue Crashes: Illinois
- Enhancing Route Choice During Construction: Utah
- Permanent ITS to Manage WZ Traffic: Las Vegas
- Performance Specification Monitoring: Utah
Expected completion of guide/case studies:
Late summer 2013
slide notes:
None
slide 31: FHWA WZ Website – ITS Section
www.fhwa.dot.gov/workzones
|
 |
slide notes:
None
slide 32: AASHTO WZ ITS Website
www.transportation.org/?siteid=42&pageid=1939
ATSSA ITS Council working on similar site |
 |
slide notes:
None
slide 33: US DOT ITS Website

- Applications Overview
- Cost Database
- Benefit Database
- Lessons Learned
- Deployment Statistics
- Document Library
- Technical Resources
slide notes:
None
slide 34: Smart WZ Deployment Initiative
- Pooled Fund Study since 1999
- Conducts studies on WZ topics including ITS
- Contains Evaluation Reports on topics such as:
- Real–time Integrated Systems (dynamic merge, traveler info, speed advisory)
- Stand Alone Warning Systems (e.g., CB Wizard)
slide notes:
None
slide 35: Why Consider Using WZ ITS Now?
- More ITS options available
- Technologies, costs, how it is provided
- Matured from earlier stage
- Greater reliability
- Better understanding
- More permanent ITS
- Wiser use
- Work zone challenges remain
slide notes:
None
slide 36: Why Use Work Zone ITS?
A study of successful deployments showed that:
- 50–85% of drivers surveyed said they changed their route in response to WZ ITS info
- Queue length reductions up to 56–60% are possible
- Speed monitoring displays reduced speeds by 4–6 mph
- One study found a 20–40% reduction in vehicles traveling > 10 mph over the speed limit when SMDs are used
slide notes:
None
slide 37: Potential Benefits of WZ ITS
- Improved mobility and traffic management
- More informed public
- Quicker incident response
- Greater safety of workers and travelers
- Better PR and relationships with other stakeholders
- Enhanced speed management
- Better understanding of traffic conditions
- One study showed a benefit–cost ratio of 2:1 and another showed a B–C ratio of 6:1
slide notes:
None
Return to List of Presentations