I-94 Work Zone Performance Measures
slide 1: I-94 Work Zone Performance Measures
Management Peer Exchange Workshop
Michigan DOT I-94 Corridor
Larry Doyle, Kalamazoo TSC Manager
Michigan Department of Transportation
Atlanta, GA – May 8, 2013
slide notes:
My name is Larry Doyle, I am Michigan DOT's (MDOT) Kalamazoo Transportation Service Center (TSC) Manger. As the Manager of the TSC I am responsible for the DOT work in three southwest Michigan counties including design, construction, maintenance, permits, and operations, for this area, including the I-94 route.
slide 2: Overview
- Great Lakes Megaregion and GRLTOC
- I-94 Corridor Operations Partnership (COP)
- Travel Time and User Delay Cost (UDC)
- Performance Measures
- Technology, Resources, Data
- Lessons Learned
- Best Practices
slide notes:
My presentation will cover our department's collaborative operational partnership with a focus on Work Zones with the three MDOT regions that are responsible for Michigan's I-94 corridor. The discussion will focus on Michigan's significance, our Corridor Operations Partnership Team, our Performance Measures, (Technology, Resources and Data), our Lessons Learned and our Best Practices.
slide 3: Great Lakes Megaregion

slide notes:
I am sure a lot of you are probably aware where Michigan is located but to give you more information; Michigan is part of the Great Lakes megaregion, which is shown as the gold area on this map. It centers on the Chicago region, encompasses several states, and has a population of roughly 60 million.
And more so than other megaregions it touches national borders, it encompasses a large portion of Canada's population and includes major border crossings between Michigan and Ontario.
slide 4: Great Lakes Region Transportation Operations Coalition
slide notes:
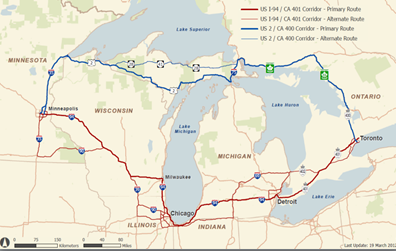
Michigan is also part of Great Lakes Region Transportation Operations Coalition (GRLTOC) which represents the approximately 1000 mile trip between Minneapolis and Toronto.
To the south, I-94, Highway 401, and associated routes emphasize work zone coordination and metropolitan issues.
To the north, US 2, Highways 17, 400, and associated routes to the north emphasize winter operations and rural issues.
I-94 is very important to the people of Michigan and to our nation's economic health:
- 28% of Michigan's population is within 20 miles of I-94
- 32% of truck freight value miles utilize I-94
- 30% of Michigan's jobs involve travel on I-94
- I-94 has an average ADT in Michigan of about 54,000
slide 5: MDOT I-94 Corridor Operation Partnership
|
 |
slide notes:
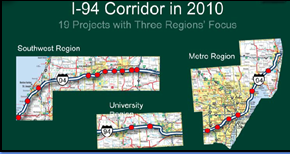
Three MDOT regions are responsible for the southern portion of Michigan, including the I-94 corridor, we use nine Transportation Service Centers to provide our customers the department's primary transportation services.
We were fairly comfortable with setting up each project's work zone and each regions' set of projects in conformance with FHWA's Work Zone Safety and Mobility Rule, but less so with the grouping of projects along the entire I-94 corridor.
MDOT's Work Zone Safety & Mobility Policy set a threshold of 10 minutes of delay for individual projects, but did not address what was acceptable for the entire 275 mile corridor. In 2010 there were 19 projects on I-94 that would mean 190 minutes – over 3 hours – of delay! Certainly that was not acceptable.
slide 6: MDOT I-94 Corridor Operation Partnership
I-94 Corridor Operation Partnership (COP) Mission: "Improve traffic operations and system reliability along the I‐94 corridor statewide."
|
 |
slide notes:
- To address corridor work zones with an eye on safety and mobility, we established an I-94 Corridor Operations Partnership with a mission to improve traffic operations and system reliability; optimizing the department's effectiveness and producing results that satisfy our customer needs.
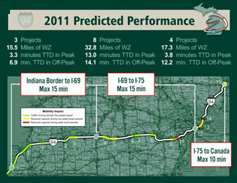
- One of our strategies was to establish what we believe to be a tolerable travel time delay for work zones along the entire corridor with three segments separated at major I-94 entry or departure points.
- We set a 40 minute delay allowance for these 275 miles of I-94. The segment limits were purposely set to cover two regions of the three regions so that collaboration was purposely required.
- Each year we map our projects onto this map with predictions of the Travel Time Delay for both the peak and non-peak periods noted for each of the three segments. To demonstrate the value of this mapping effort, in 2011, two projects in our Detroit metro region were modified prior to the letting because the calculated Travel Time Delays exceeded the allowable prediction.
slide 7: Travel Time Delay and User Delay Cost
UDC is a fairly easily defined and comprehendible metric for transportation professionals as well as the public and other partners in highway operations
| User Delay Cost | Travel Time Reliability |
|---|---|
| Tangible, Relatable Unit of Measure | More Comples "Index" |
| Real Time, Up to the Minute | Good for Long Term Trends, but Loses Meaning at Hourly Increments |
| Accounts Well for Variation in Volume, Location, & Time of Day Impacts | Not as Reflective of Volume, Location, and Time of Day Impacts |
| Actionable: Allows for Proactive & Active Management that Connect to Results | Difficult to Tie Actions to Outcomes |
slide notes:
MDOT has utilized User Delay Cost (UDC) as its central performance metric.
It is a calculation based on volume of traffic, delay time (as a result of reduced travel speeds), and unit costs for delay per vehicle; taking into account both commercial and passenger vehicle types. MDOT's experience with UDC has demonstrated its effectiveness as a performance management measure for highway operations in several ways.
- UDC, which is expressed in terms of dollars, is a tangible, relatable unit of measure, easily understood by most people. Virtually everyone can relate to the value of a dollar.
- UDC is also more effective because it can be computed in real time, almost right up to the minute. This allows personnel to see the changes in the system and the impacts of their actions on the performance of the system.
- Because UDC is a calculation based on traffic volumes, it does a better job of distinguishing between locations across the system where volumes can vary significantly.
slide 8: User Delay Cost Breakdown – MDOT Southwest Region
- Recurring Vs. Non-recurring Delay
- Recurring congestion is the baseline.
- Non-recurring are above the baseline; examples, winter, work zones and traffic incidents.
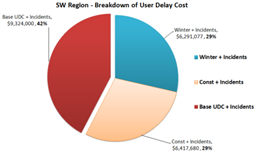 |
 Breakdown is based on a three-year average provided by RITIS. |
slide notes:
User Delay Cost Breakdown:
- We broke down delay in two categories (Recurring and Non-recurring) to see where we should focus our efforts to reduce it. In the Southwest Region a majority of delay was non-recurring with the three main causes being winter weather, incidents and work zones.
- We calculated the allowable user delay cost for each cause while still taking into account the recurring delay or normal delay caused by typical traffic congestion. We used a three year average of recurring and incident delay as the baseline value. The baseline was identified as the month with the least three year average UDC. Winter and work zone delay are above the baseline.
- The top pie chart shows that the recurring and incident delay (Show in Red) accounted for 42% of the total, while the winter and incident delay (shown in blue) accounted for 29%, and the construction and incident delay also accounted for 29%.
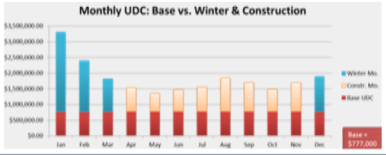
- The bar graph on the bottom shows our monthly UDC goal each month broke down with the baseline, winter and construction with each having its share of incident delay added. The orange color shows the construction delay goal for April to November. This is what construction will be measured against.
slide 9: MDOT Southwest Region I-94 Performance Measures
Evolution of work zone performance measures
- 2010 – Time (project level)
- 2011 – Time (corridor level), Speed and MOT
- 2012 – Speed and MOT
- 2013 – Time (predicted versus actual), Cost and Communication
- Performance Measurement Elements:
- Cost due to delay in work zone
- Time (Project and Corridor level)
- Speed
- Maintenance of Traffic (MOT) Implementation
- Communication
slide notes:
Evolution of work zone performance measures.
2010 – 10 min max delay per project requirements
In 2011 at the corridor level we added the 40 min of max delay along the entire 275 miles which we still use but we also added a number of other performance measures for the Southwest Region:
- 2011 – Work Zone compliance, 20– min max delay from Indiana to region boundary 95% of the time, 90% speed compliance, 10 min per project requirement
- 2012 – Work zone compliance, 10-min per project requirement,
- 2013 – Maintenance of traffic huddles, 10-min per project requirement, construction UDC, CO3 predicted delay versus actual delay
slide 10: MDOT Southwest Region I-94 Performance Measures
Cost Performance Measurements
Cost Performance Measure: Limit the 2013 user delay cost on the I-94 corridor to $108 million.
 Weekly UDC vs Goal |
 UDC Weekly Summary |
slide notes:
Cost Performance Measurement:
- UDC is tracked hourly, Weekly and Year to Date. We use this data to create scoreboards to see if we are winning at meeting our goals.
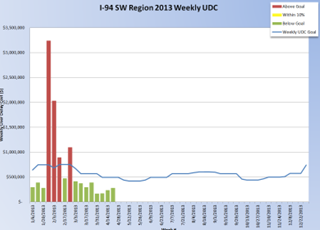
- The bar graphs in the middle right show our actual UDC year to date and weekly UDC. Green means we are winning and red means we are not. The blue line shows our goal.
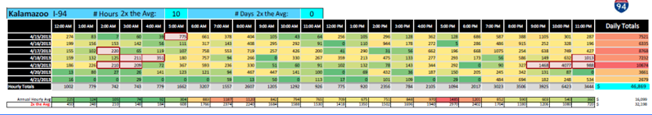
- The bottom chart shows our weekly UDC by day and hour for a particular segment of I-94. We review this weekly to see when we had high UDC and correlate it to an incident, winter weather or a work zone.
- While we have been keeping track of total UDC on I-94 since 2011 in 2013 we are separating the UDC between construction and winter as a better way to measure our performance. Before when we just tracked total UDC we could already be well below the goal before construction started, now construction has its own UDC goal.
slide 11: MDOT Southwest Region I-94 Performance Measures
Time Performance Measurements
Travel Time Delay: Maintain a maximum of 40 minutes travel time delay for the I-94 corridor
Travel Time Results by Segment
slide notes:
As discussed our first Time Performance Measurement was the goal of having less than 10 min of delay per project. We estimate this utilizing the computer program Co3 developed by University of Michigan. To check the actual delay versus the calculated delay can be as easy as driving the work zone during peak times and measuring the actual delay.
Our next time performance measurement goal was maintaining a max of 40min of travel time delay along the I-94 corridor. Checking the actual delay versus the calculated delay for this measurement was more complicated. First we had someone drive the corridor weekly during the construction season and measure the travel time delay. While the delay measurements were almost always below the goal we felt this was not an accurate measurement of the delay that most motorist experience unless they were driving at the same time, starting and ending at the same place when our measurement was done.
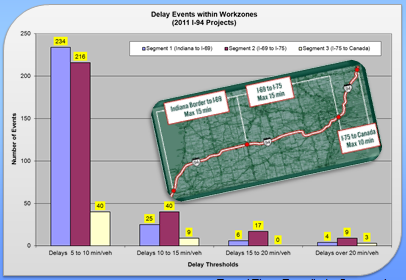
In 2011 we utilized OpsTrack on a trial basis which we used to calculate the travel time delay shown in the bar graph broken down by each corridor segment and by the various levels of delay (5-10, 10-15, 15-20 and over 20 min). Again we felt this was not a true picture of what motorist were experiencing.
Starting in 2012 we started using the Regional Integrated Transportation Information System (RITIS) with our focus on UDC as our primary performance measurement.
slide 12: MDOT Southwest Region I-94 Performance Measures
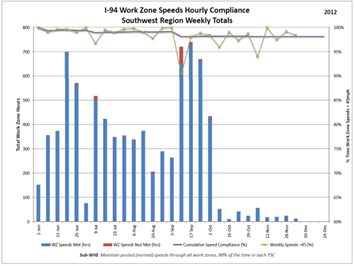
Speed Performance Measurements
 |
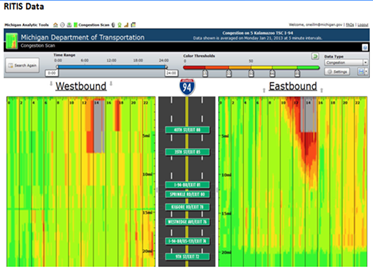 RITIS Heat Map |
slide notes:
Speed Performance Measurements:
- In 2012 we started tracking vehicle speeds in Work Zones to see if we were meeting our goal to maintain posted speeds in work zones 90% of the time.
- The graph on the left shows work zone speed compliance. The blue bars show the number of hours when work zone speed met the goal and the red portion of the bars show when we did not meet. The line graph shows the cumulative speed compliance percentage.
- The image on the right is a heat map from RITIS showing delay in red in relation to time and location along the corridor.
slide 13: MDOT Southwest Region I-94 Performance Measures
Maintenance of Traffic Performance Measurements
Work Zone Set-Up Compliance: Perform two work zone reviews per week at each project set-up and stage change 90% of the time.
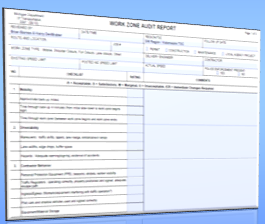
Work Zone Setup Review Report
slide notes:
- In 2011 and 2012 each office performed two work zone reviews per week at each project set-up and stage change 90% of the time.
- They reviewed the work zone for mobility, drivability, and safety issues. They also measured backups and measured travel times through the work zones so that they could be compared to what was predicted.
- If the review found significant issues it provided the process to discuss the issue to have it addressed quickly. The reviews resulted in increased communication between design, traffic and operations and construction staff which was great.
slide 14: MDOT Southwest Region I-94 Performance Measures
Communication Performance Measurements
Communication Performance Measure: Perform maintenance of traffic huddles (MOTH) for 90% of weeks with active work zones.
This measure targets:
- Communication between operations and construction
- Incorporate maintenance, permits, construction work zones each week
slide notes:
Communication Performance Measurements:
- Starting this year we are performing maintenance of traffic huddles (MOTH) where we discuss active work zones each week with Operations, Construction, and Maintenance Staff to ensure coordination of active work zone. As part of this communication we also compare the predicted UDC versus the actual UDC from RITIS in an effort to improve the accuracy of the predicted UDC.
slide 15: MDOT Southwest Region I-94 Performance Measures
Resources, Technology and Data
|
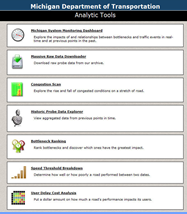 Regional Integrated Transportation Information System (RITIS) |
slide notes:
Resources, Technology and Data:
- In 2011 MDOT began a shift in staffing towards a more operations focus. This staff is responsible for tracking user delay due to incidents, work zone and winter weather. During this same time ITS infrastructure was being implemented in southwest Michigan which provided enormous amounts of data.
- Using traffic speeds from a combination of sensor and "probe" vehicle data, MDOT has been able to estimate UDC for corridors and segments of the system on a routine, continual basis, thereby reflecting changes in system operations triggered by traffic incidents, work zones and weather events. Initially, these UDC estimates were fairly crude, based on snapshots of "red images" from system speed maps. Over time, MDOT has improved its UDC estimates, as well as the process for collecting and computing the data, through the use of automated analytical tools, most notably the RITIS.
slide 16: MDOT Southwest Region Lessons Learned
Lessons Learned
- Change in behavior/culture
- Speed has the most influence to the goal
- Project development is key to success
- Applying experience helped us to refine lane restrictions and work operations
- Testing cultural change to measure communication
Mission: Improve traffic operations and system reliability along the I-94 corridor statewide
slide notes:
Lessons Learned:
We have learned a lot since implementing work zone performance measures:
- Keeping score has had a significant change in the behavior/culture
- Maintaining Posted Speeds has the most influence to the goal
- Project development is the key to success; if a project is designed to minimize work zone delay then it likely will have minimal delay.
- Applying experience helped us to refine lane restrictions and work operations
- Once construction staff was being evaluated on UDC they started asking the designers questions about the anticipated delay during project reviews; which was a huge culture change.
slide 17: MDOT Southwest Region I-94 Performance Measures
Best Practices
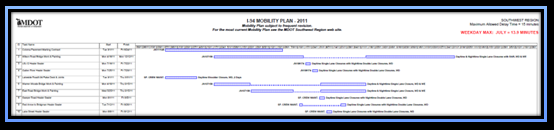
- Region work zone Gantt Chart
- Incorporation of maintenance activities
- Project level delay mitigation
- Towing incentives
- Off peak work based on delay measures
- Increase in the use of incentive/disincentive
- Incorporation of new ITS infrastructure
- Customer focus with emphasis on continuous improvement
slide notes:
Best Practices
- Over the last four years we have utilized the performance measures I shared with you today which brought forward a new way of thinking of how we can reduce delay to meet our goals.
- To have a clear understanding of the magnitude of projects along a corridor like I-94 we developed a Gantt Chart with all of our construction projects laid out with the project location and construction duration. We utilized this chart to not only schedule construction projects but also when to schedule maintenance work along the corridor so that we would not exceed our user delay cost goal.
- Some additional best practices at the project level include using towing incentives in individual projects so when there was a crash or vehicle breakdown the delay would be minimized. We also are scheduling more work during off peak times and utilizing incentive and disincentive measures to minimize construction work zone durations.
- Incorporation of ITS infrastructure in southwest Michigan has provided the ability to not only see delay issues directly from the office but has also provided the ability to post relevant messages to motorists to give the driver the ability to make informed decisions about travel routes.
- Our increased engagement in highway operations especially with including maintenance, construction, and design staff is truly showing the impact we can have on improving the flow of traffic for our customers.
slide 18: Questions?
MDOT wants to deliver Outstanding customer service.
Please tell us: WWW.MICHIGAN.GOV/MDOT
slide notes:
None
Return to List of Presentations