Using Private Sector Probe Data to Examine Work Zone Performance: The Virginia DOT Experience
slide 1: Using Private Sector Probe Data to Examine Work Zone Performance: The Virginia DOT Experience
Mike Fontaine, Ph.D., P.E.
Virginia Center for Transportation Innovation & Research

slide 2: Motivation
- FHWA Work Zone Self Assessment Questions:
- Has the agency established measures to track work zone congestion and delay?
- Has the agency established work zone performance guidance on maximum queue lengths, maximum traveler delay, etc?
- VDOT has allowable work hours but no established program to track
slide 3: Approach
- Work zone safety coordinators met to discuss "ideal" measures
- Desired measures:
- Queue Length
- Speed/delay/travel time
- Reliability
- Finishing research project to examine measures and define data sources and management tools
slide 4: Constraints
- Manpower/cost
- Data abailability
- Are sensors available?
- Are they functional?
- Projuect duration
- Monitoring short term projects
- Project phasing impacts
- Need to reposition sensors
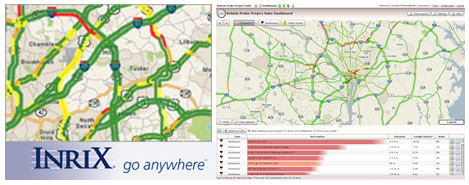
slide 5: Private Sector Sources of Travel Time Data: INRIX
- INRIX dervies travel times from a variety of sources, including fleet and passenget vehicle probes
- Sells travel time data, does not install sensors
- Speed and travel time only, no volume
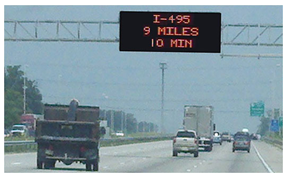
slide 6: INRIX Use by VDOT
- VDOT has statewide real time data from INRIX
- Feeds real time traveler information (VMSs in DC, SE Virginia, soon Richmond; 511 app)
- Very well received by public
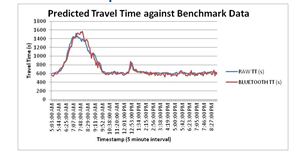
slide 7: INRIX Data Quality
- VDOT has conducted internal validation using Bluetooth benchmark on over 340 miles of freeway
- 95% within 10mph
- 75% within 5mph
slide 8: Work Zone Metrics Being Examined Using INRIX Data
- Research project to examine viability of using INRIX data for WZ performance measurement:
- Queue length
- Use INRIX bottleneck definition
- 60% of speed typically observed at that time of day
- speed/delay
- Reliability measures (95th percentile speed, buffer index, planning time index)
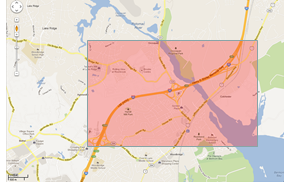
slide 9: Case Study: I-95 SB, MP 158-162
- Remove cantilever sign structure at 9PM on 2/17/12
- 2 of 3 SB lanes closed
- Impacts for about 6 hours over 3 miles
slide 10: Long Term Work Zone Tracking
| Time | Historic Speed (mph) | Queue Threshold Speed (mph) | Observed Speed (mph) | Delay (min) | Queue (mi) |
|---|---|---|---|---|---|
| 9-10 PM | 52.6 | 31.6 | 22.1 | 9.7 | 1.90 |
| 10-11 PM | 61.8 | 37.1 | 10.1 | 21.2 | 3.03 |
| 11- Mid | 61.8 | 37.1 | 10.5 | 20.4 | 2.26 |
| Mid - 1AM | 61.8 | 37.1 | 9.5 | 22.5 | 3.03 |
| 1-2 AM | 61.8 | 37.1 | 8.5 | 25.1 | 3.03 |
| 2-3 AM | 61.8 | 37.1 | 22.6 | 9.5 | 0.84 |
slide 11: Long Term Work Zone Tracking
- 8 Freeway Work Zones:
- Lengths: 1.97 to 11.9 miles long
- 55 to 65 mph speed limit
- Directional AADT between 4,800 and 25,230
- Interchange density between 0 to 0.5 interchanges/mile
- 7 Arterial Work Zones:
- Lengths: 1.04 to 7.2 miles long
- 35 to 60 mph speed limits
- Directional AADT between 1,757 and 9,005
- Between 0 and 4.6 signals/mile
slide 12: Work Zone Impacts on Mean Speed and 95th % Travel Rate
- Used entire 24 hours
- Significant degradations in both measures, especially on freeways
| Facility Type | Mean Speed (mph) | 95th% Travel Rate (sec/mi) | ||||
|---|---|---|---|---|---|---|
| Base | WZ | Δ | Base | WZ | Δ | |
| Freeway | 60.08 | 56.58 | -3.50* | 79.01 | 104.72 | +25.72* |
| Arterial | 38.31 | 37.68 | -0.63 | 131.16 | 133.19 | +2.03 |
| Combined | 51.12 | 48.80 | -2.32** | 100.48 | 116.45 | +15.96** |
| *Significant at α=0.10 **Significant at α=0.05 |
||||||
slide 13: Work Zone Impacts on Buffer and Planning Time Index
- Used entire 24hours
- Significant degradations in both measures, especially on freeways
| Facility Type | Buffer Index (%) | Planning Time Index | ||||
|---|---|---|---|---|---|---|
| Base | WZ | Δ | Base | WZ | Δ | |
| Freeway | 26.00 | 46.33 | +20.33 | 1.386 | 1.804 | +0.417* |
| Arterial | 25.02 | 26.01 | +0.99 | 1.527 | 1.545 | +0.019 |
| Combined | 25.60 | 37.96 | +12.37** | 1.444 | 1.697 | +0.253** |
| *Significant at α=0.10 **Significant at α=0.05 |
||||||
slide 14: Lessons Learned
- INRIX real time confidence scores and confidence values
- Data availability
- Issues with spatial match to work zones
- Issues with temporal aggregation
- Treatment around threhold values
- Full road closures
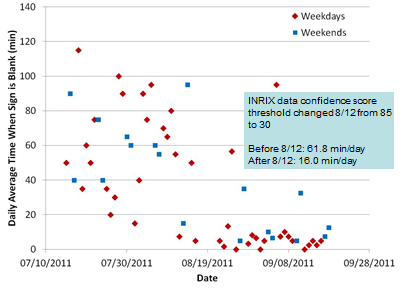
slide 15: INRIX Confidence Scores/Values
- INRIX indicates 3 levels of confidence:
- "10"– Historic data
- "20"– Blend of historic and real time data
- "30"– Purely real time data
- Scores > 10 also have a confidence value from 0-100 indicating degree of agreement with past trends and recent data
- Callenge is to weigh responsiveness with accuracy
slide 16:
slide 17: Data Availability
- Real time data availability of 98% or more during daytime periods on freeways
- Data availability sometimes suffers overnight (Midnight to 4 or 5 AM)
- Some data issues on arterial system outside of high colume NHS routes
- Data availability is moving target
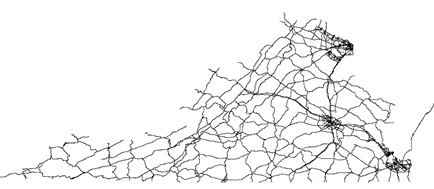
slide 18: Spatial Mismatch Issues
- Data is reported using Traffic Message Channel (TMC) links
- Typically located between major intersections
slide 19: Matching Private Data to Work Zones
- TMC boundaries often do not precisely align with work zone boundaries/impacts (or DOT roadway inventory links)
- Differences in lengths (TMC-Work Zone, 18 work zones)
- Freeways: Mean of +1.16mi
- Arterials: Mean of +2.42 mi
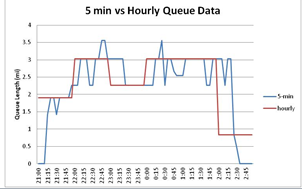
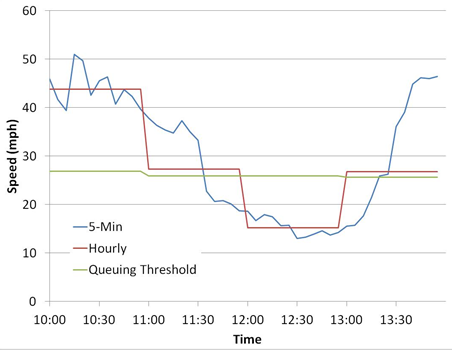
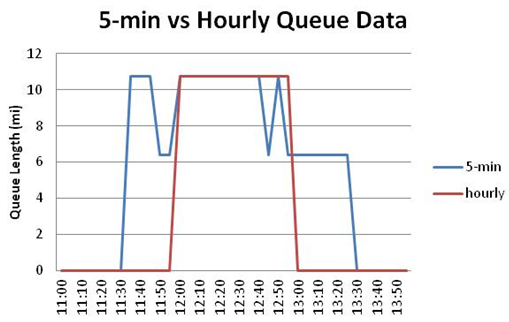
slide 20: Temporal Aggregation
- Long aggregation intervals can "wash out" localized impacts
- Short time intervals require more resources to analyze
- Project level vs. programmatic tradeoffs
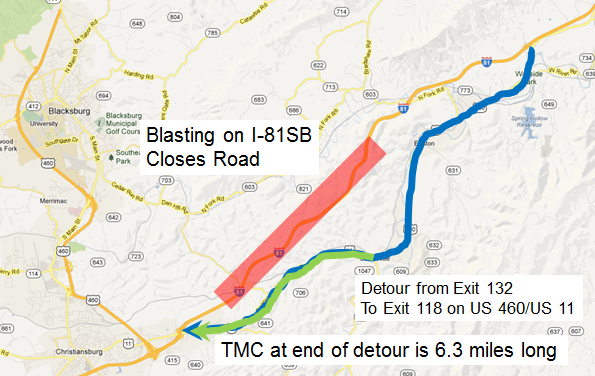
slide 21: Case Study: 1-81 and US 460/11
slide 22: Speeds and Queuing Threshold
slide 23:
slide 24: Full Road Closures
- If there is a full road closure, INRIX will report scores of "10" since they have no data unless they have been notified.
- Need to account for this in performance measure calculations
slide 25: Summary Private Sector Probe Data
- Advantages:
- No infrastructure to install/maintain
- Good data quality on freeways
- Large coverae area
- Useful for many other purposes
- Limitations
- Spatial granularity
- Arterial coverage
- Overnight coverage
- Does not directly measure queuing
slide 26: Next Steps
- TMC granularity
- INRIX indicates improvements are coming to overcome long TMC lengths in rural areas
- VDOT is reviewing data now to try to determind where to set performance threshold values
- Parallel effort to develop system that integrates probe data with detector data in user friendly archive
slide 27: Questions?
- Mike Fontaine, P.E., Ph.D.
- 434-293-1980
- Michael Fontaine@VDOT.Virginia.Gov