Work Zone Application of Bluetooth Traffic Detection
slide 1: Work Zone Application of Bluetooth Traffic Detection
FHWA Work Zone Peer Exchange, Atlanta, GA
May 8, 2013
John W. Shaw, P.E.
Traffic & Data Microsimulation Manager
Wisconsin Traffic Operatiosn and Safety Laboratory
slide 2: Would You Like To...
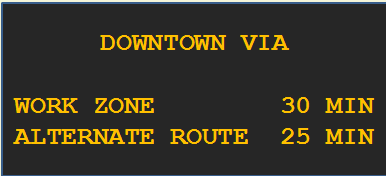
- Know when traffic in your work zone is starting to slow down?
- Provide travel times for alternate routes?
slide 3: Would You Like To…
- Compare actual work zone delay with what was predicted in the TMP/MOT?
- Evaluate locational differences in work zone throughput?
- See how much traffic diverted to the alternate route?
- See whether people who diverted actually saved time?
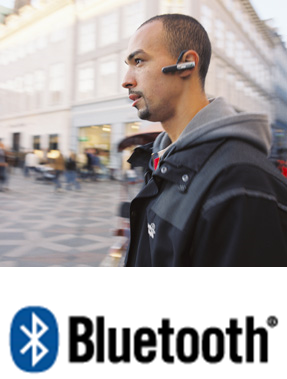
slide 4: What is Bluetooth?
- 2.4 GHz wireless system for connecting electronic devices.
- Low power, low cost.
- Range ∼100 meters.
- High level of data/content security.
- Every device has unique MAC address.
- No master database of MAC addresses.
- Used for traffic detection since 2008.
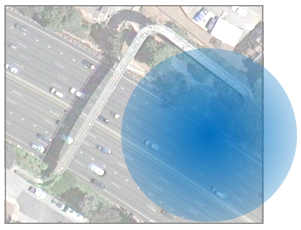
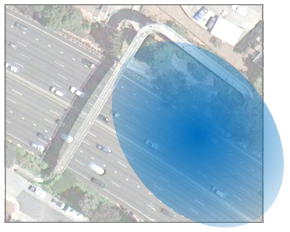
slide 5: Bluetooth Data Collection
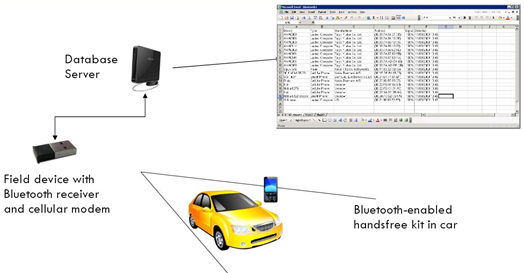
slide 6: Bluetooth Data Collection
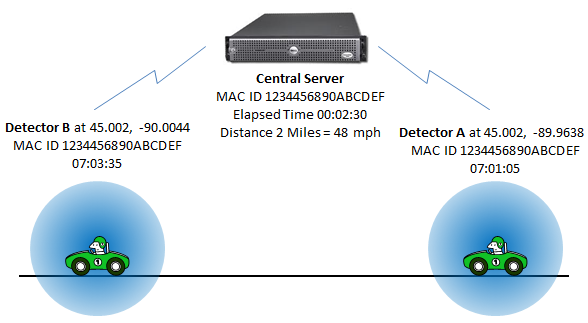
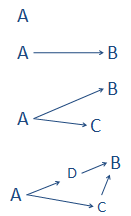
slide 7: Vehicle Re-Identification Process
- "Listen" for Bluetooth MAC addresses at two or more locations.
- Record observation time and location.
- Transmit observations to central server.
- Match MAC addresses spatially.
- Compute travel time.
- Filter out unreasonable travel times.
- Evaluate and Report Speed, OD and Route.
- Combine with volume data if appropriate.
slide 8: What Can Bluetooth Do?
|
 |
slide 9: By Itself, Bluetooth Provides…
- Discrete, time-stamped observations of people/vehicles moving around.
- But NOT traffic volume.
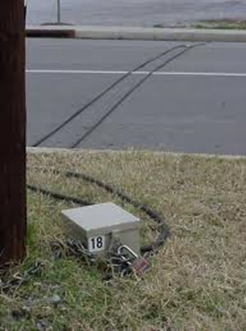
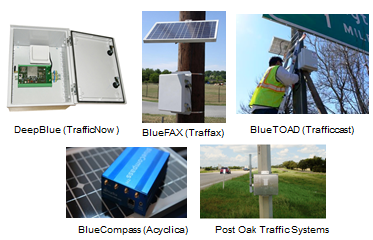
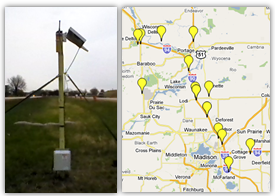
slide 10: Field Equipment
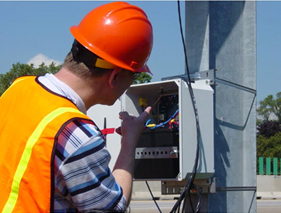
slide 11: Installation
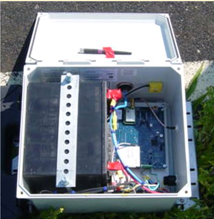
slide 12: Equipment Set-up
slide 13: Cabinet-Mount Examples
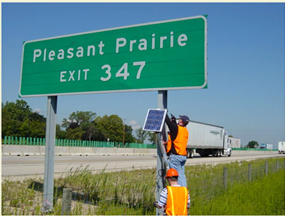
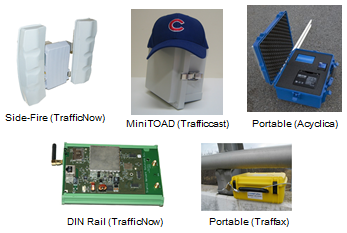
slide 14: Other Configurations
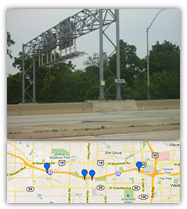
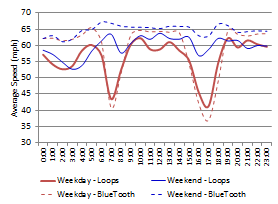
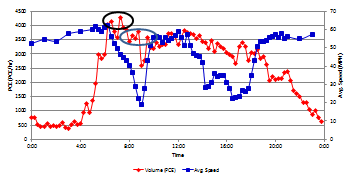
slide 15: Travel Time – Western Milwaukee Suburbs
|
 |
slide 16: Findings
- Loop speeds low in free-flow conditions
- Loop speeds too high in congestion
- BT pairing sampling rate <3% (2010)
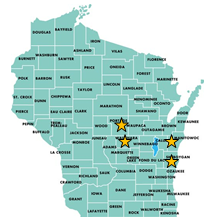
slide 17: Recent Work Zone Field Studies
- Milwaukee
- Portage
- Grafton
- Endeavor
slide 18: Work Zone Traffic Performance
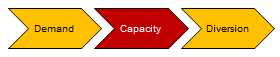
slide 19: Freeway Work Zone Capacity
Why do some work zones operate better than others?
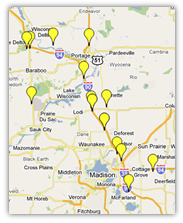
slide 20: Rural Freeway WZ Capacity, Delay & Route Choice (Portage, WI)
- Weekend recreational route
- 30+ miles
- 13 BT units
- Mainline + Alternates
- Volume counts
slide 21: Results: Rural Freeway Capacity
slide 22: Results: Rural Route Choice
- Drivers can respond to WZ congestion in a variety of ways.
- Modest increases in traffic on alternate routes
- Relatively few exited and then returned to freeway.
- More commonly, local traffic stayed on local routes until past the work zone.
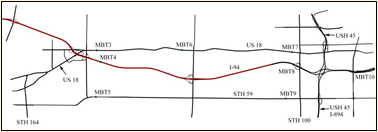
slide 23: Urban Freeway WZ Capacity, Delay & Route Choice (Milwaukee Suburbs)
- Freeway Mainline + Two Alternate Routes
- Bluetooth Detectors + Volume Counts
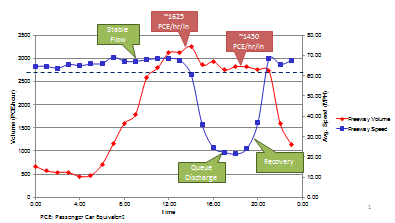
slide 24: Results: Urban Freeway Capacity
Stable Flow
AM: 1825-2200 PCE/hr/lane
PM: 1825-1950 PCE/hr/lane
Queue Discharge
AM: 1600-1825 PCE/hr/lane
PM: 1725-1825 PCE/hr/lane
slide 25: Results: Urban Route Choice

- Commuters very willing to use alt routes.
- Increased traffic on alt routes even when mainline was not congested.
slide 26: Lessons Learned
slide notes:
None.
slide 27: Lessons Learned
slide 28: Lessons Learned
- Detection rates vary by route type and time of day.
- Since Jan 2012, USDOT requires truck drivers to use hands-free devices.
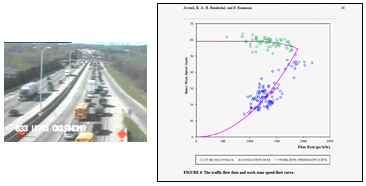
slide 29: Data Processing Matters
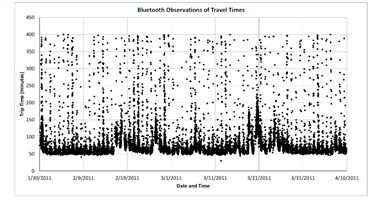
Figure 13. Raw Observations, US-50, South Lake Tahoe, CA to Placerville, CA
slide 30: The Secret is in the Software
Options
- Proprietary vendor-supplied filtering and matching services
- Free software from sensor vendors (basic)
- Third-party software (advanced)
slide 31: Bluetooth vs. Side-Fire Radar
Bluetooth
- Speed (lagging)
- Travel time for a route segment
- Accurate at all speeds
- Many mounting options
- Observes all traffic
- Low power consumption
- Requires at least 2 detectors
- $2500-5000 per detector
- Some vendors offer rental
Radar
- Speed + Volume
- Point speed at a specific location
- Not accurate at low speed
- Pole-mount at roadside
- Observes specific lanes
- 8 to 11 watts continuous
- Can get data from a single detector
- About $5000 per detector
slide 32: Bluetooth Pro & Con
Strengths
- Inexpensive
- Low power consumption
- Highly accurate speed data
- Easy to extend study duration
- Efficient method for collecting OD info
- Only practical way to collect route choice data
Limitations
- Low sampling rates
- Capture rates can vary by time of day (prob. trucks)
- Sometimes sensitive to:
- Site Characteristics
- Antenna Placement
- Loss of Power/Comm
- Data processing assumptions
slide 33: Questions?
slide 34: Presenter Contact Information
John W. Shaw
jwshaw@wisc.edu
414-227-2150
Return to List of Presentations