Road User Cost Analysis for Work Zone Applications
Printable Version [PDF 2.26MB]
You will need the Adobe Reader to view this PDF.
Contact Information: WorkZoneFeedback@dot.gov
November 15, 2011
slide 1
Road User Cost Analysis for Work Zone Applications
Jawad Paracha
Work Zone Safety & Mobility Team
FHWA Office of Transportation Operations
Jagannath Mallela
Principal Engineer
ARA, Inc.
November 15, 2011
![]()
![]()

slide notes
Good afternoon. I am Jawad Paracha with WZ safety and mobility team in office of transportation operations at FHWA. I would like to first thank you all who are participating in today's webinar on RUC analysis for WZ applications.
slide 2
WZ Road User Costs (RUC)
- Overview
- Road work has been on rise
- FHWA Rule on Work Zone Safety & Mobility (23 CFR 630 Subpart J)
- RUC provide economic basis for quantifying adverse impacts and effective decision-making
- Base document:
- Work Zone Road User Costs: Concepts and Applications, FHWA-HOP-12-005,
To be Released December 2011
- Work Zone Road User Costs: Concepts and Applications, FHWA-HOP-12-005,
slide notes
- As you know road work has been on rise and is expected to increase further sharply as we try to meet system preservation needs, add capacity to existing network and build new facilities to meet growing transportation needs.
- We, also, know that this road work can result in significant safety and mobility impacts to road users … it can result in inconvenience to local business and community, noise and environmental impacts. FHWA's Rule on Work Zone Safety and Mobility (23 CFR 630 Subpart J) requires systematic consideration and management of work zone impacts throughout project development and implementation. Road user costs (RUCs) provide the economic basis for quantifying these adverse impacts which can then be used for effective decision-making to reduce WZ impacts and thus improve safety and mobility.
- This webinar is mainly based on a soon-to-be published report titled Work Zone Road User Costs—Concepts and Applications. We will notify all registered participants of this webinar as soon as the report is available online.
slide 3
Work Zone Road User Costs
- Project Objectives:
- Synthesis of current RUC practices and tools
- Establish a framework for WZ RUC analysis
- Guidance on RUC applications:
- MOT strategy related decision-making
- Project delivery methods and contracting strategy selection
- WZ impacts and B/C analysis

slide notes
- Increasing number of agencies take RUC into consideration for decision-making during project development. An example would be considering project costs that include RUC as compared to simply considering agency or construction costs when analyzing project alternatives.
- As we were looking at various resources available to practitioners to assess WZ impacts, we found out that there is a need to explain WZ road user cost concepts in a document that is easy to understand and use for practitioners…where we can provide computation steps using a step by step approach supported by example applications such as MOT alternative analysis, use of contracting strategies such as A+B and I/D, and analyze construction methods such as use of ABC.
slide 4
Presentation Outline
- WZ RUC: Definition, Applications, Components and Computation
- Q&A
- Application of WZ RUC in MOT Alternate Analysis
- Illustrative Example
- Q&A
- Application of WZ RUC in Contracting/ Project Delivery Methods
- Illustrative Example
- Application of WZ RUC in Benefit-Cost Analysis
- Illustrative Example
- Q&A
slide notes
The remaining webinar will be broken into 3 main parts…. And every part will be followed by time for Q&A.
In the first part, we will present WZ RUC framework, key factors, and computation steps.
In the second part, we will present one way to systematically consider WZ impacts, both quantitative and qualitative, during MOT alternative analysis.
In the third part, we will present ways to consider WZ impacts for decisions such as need for project acceleration, contracting strategy, and I/D calculations.
During the second and third parts of this webinar, we will use case studies or example project applications to discuss concepts and computation steps. As these projects had already been completed, a number of assumptions were made to demonstrate various applications of WZ RUCs.
Now I am requesting Jag Mallela, a Principal Engineer at ARA, to present RUC concepts and applications.
slide 5
WZ RUC Definition Components and Computation
slide notes
None
slide 6
WZ RUC Definition
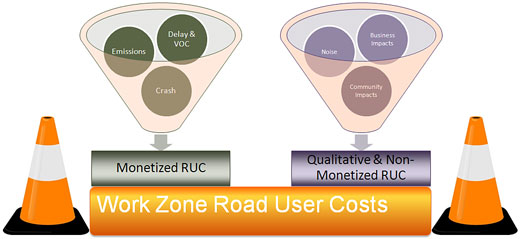
- "WZ RUC is the additional cost borne by the motorists and local communities due to work zone activity."
slide notes
Key Message: This slide presents the key components of work zone RUC which include both costs to the motorists passing through the work zone as well as costs to the local communities as well.
It is noted that the traditional definition of WZRUC primarily includes with the monetized components of work zone impacts to motorists such as delay and vehicle operating costs or VOC. The report discusses these costs along with the crash and emissions costs in a rigorous manner. Other off-site cost components are discussed but are not considered rigorously because:
- Factors influencing their computation are site specific.
- No generalized method or tool is yet available – These impacts are hard to monetize.
slide 7
Applications of WZ RUC
- System preservation and improvements
- e.g. life cycle cost analysis of pavements, bridges and pavement markings
- Contract administration
- e.g. determination of incentives and disincentives
- MOT strategy selection
- e.g. selection of work zone MOT strategies
- Benefit-cost analysis of capital investments
- e.g. economic efficiency of construction innovations
- Operational efficiency of work zones
- e.g. post-construction mobility and safety performance review
slide notes
Key Message: This slide presents some of the key application areas of WZ RUC.
Traditionally the WZ RUC has been used in the life cycle cost analysis of highway structures such as pavements and bridges. The application of WZ RUC in LCCA is well established. Application in other areas is still nascent and is the focus of this presentation and report.
slide 8
WZ RUC Computation Process
Data gathering
- Traffic data/studies
- WZ configuration
- MOT/TMP strategies
- Historical crash records
- Influence area
- Public outreach
Tools
Impacts
- Delay impacts
- VOC
- Safety impacts
- Emissions
- Local community inconvenience
- Noise
Unit costs
Total WZ RUC
- Delay costs
- VOC
- Crash costs
- Emission costs
- Noise
- Qualitative impacts
Decision Making
- LCCA
- MOTAA
- Alternative contracting
- Benefit- cost analysis
slide notes
Key Message: This slide presents the snapshot of the overall WZ computation process. It should be noted that computing the RUC numbers is only one aspect of the overall process.
The computation process begins with (1) data gathering (2) work zone impact assessment (3) unit cost determination (4) estimation of WZ RUC components and (5) applications in decision making. The process is applicable at various stages of a project's life cycle: in project scoping, in preliminary engineering phase and in design, construction and in-service (for maintenance and rehabilitation) phases of a project.
slide 9
Tools for WZ RUC Computation
- Work Zone Traffic Impact Analysis Tools
- Sketch-planning tools
- State-specific tools (e.g. Michigan's CO3, Colorado's WorkZone-RUC)
- QUEWZ-98
- Quick Zone
- CA4PRS
- Simulation tools
- Macroscopic (e.g. PASSER)
- Mesoscopic (e.g. DYNASMART)
- Microscopic (e.g. CORSIM)
- Sketch-planning tools
- Economic analysis tools
- Life cycle cost analysis (RealCost)
- Benefit cost analysis (HERS-ST, MicroBENCOST, Cal B-C, BCA.Net)
slide notes
Key Message: Various tools are available for traffic impact analysis. Generally speaking, micro and mesoscopic tools give better delay estimates.
The report on which the presentation is based recommends the use of FHWA Traffic Analysis Tool box (Vol. IX) for guidance on tool selection. The report also presents a brief description, capabilities, input and outputs, advantages and disadvantages for each sketch planning tool.
- Work zone traffic impact tools are used to estimate the mobility impacts, which in turn, are used in the WZ RUC computation.
- Sketch-planning tools generally provide rough estimation of impacts based on demand-capacity analysis.
- Simulation tools, particularly the meso and microscopic simulation tools, provide more accurate results – recommended for high impact projects.
- Each tool has its unique features, advantages and disadvantages.
- Economic analysis tools generally have traffic analysis tools in-built in the program.
slide 10
3 Steps to Estimate Monetary Components
- Estimate work zone impacts
- Mobility impacts (e.g., delay, VOC) → traffic/economic analysis tools
- Crash rates/frequency → project-specific historical records
- Emission rates → static or dynamic emission factor models
- Derive unit costs for each impact (use the Bureau of Labor Statistics economic indices for unit cost adjustments)
- Mobility → monetary value of travel time & vehicle operating costs
- Crash → human & comprehensive costs by crash severity
- Emissions → air pollutant damage costs ($/ton)
- Monetize impacts
slide notes
Key Message: Mention that the report provides detailed guidance on all the three steps.
slide 11
Estimating Travel Delay Costs
slide notes
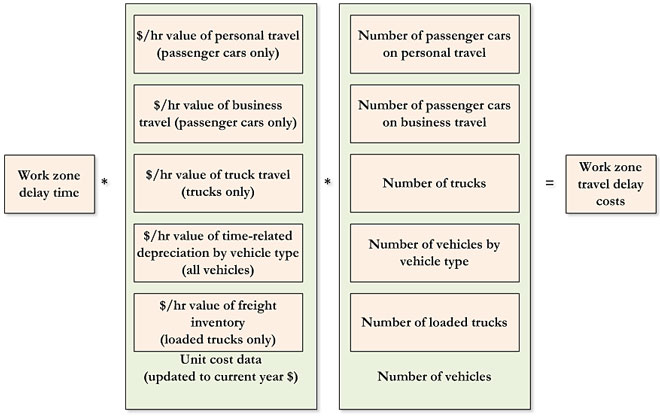
Key Message: Aggregation of 5 different components as shown – delay to personal travel and business travel for autos, truck delay, freight inventory delay and delay related vehicle depreciation.
Once the individual impacts are known, they can be further analyzed to estimate road user costs. Shown here is the detailed delay cost estimation flow chart. In this example, once the average delay time through a work zone is known, it can be used to estimate the 5 major subcomponents of delay costs, namely, delay to personal travel and business travel for autos, truck delay, freight inventory delay and delay related vehicle depreciation. Note that typically agencies do not separate personal and business travel delay for autos and do not consider freight inventory delay costs and delay related vehicle depreciation costs as these are smaller components of the overall costs. However, the report presents guidance on all the delay cost components for completeness.
slide 12
Estimating Personal Travel Delay Costs (Autos)
- Determine the proportion of passenger cars on personal travel
- National averages may vary with local or intercity travel
- Establish the average vehicle occupancy (AVO) of cars
- National averages from National Household Travel Survey (NHTS)
- Estimate per person-hr value of personal travel time
- Uses median annual income reported by the U.S. Census Bureau (OST guidelines)
- Compute per vehicle-hr value of travel time (=Step 2*Step 3)
- Compute travel delay costs for passenger cars (=Step 4*total delay time estimated from traffic studies/modeling)
slide notes
Emphasize the importance of using locally derived data for unit costs particularly for high impact projects.
The report provides step-by-step procedures for other components of delay costs. These steps are not presented herein for the time-related constraints.
slide 13
Estimating Vehicle Operating Costs
- VOC components
- Fuel and engine oil consumption
- Tire-wear
- Repair and maintenance
- Mileage-related depreciation
slide notes
Components of VOC
slide 14
Estimating Vehicle Operating Costs
- Work zone through traffic (includes forced flow condition)
- Speed change, stopping and idling conditions
- VOC models
- NCHRP Report 133 (implemented in RealCost)
- Texas R&D Foundation – Zaniewski et al (e.g. MicroBENCOST)
- HERS-ST – modified Zaniewski equations
- Detour traffic (assuming no forced flow on detour routes)
- Per-mile costs
- VOC models (at constant speed conditions)
- AAA Your Driving Costs
- American Transportation Research Institute – ATRI (for trucks)
- Per-mile costs
slide notes
Traffic flowing through a work zone undergoes (1) speed change in free-flow condition (2) speed change, stopping and idling in forced flow condition.
VOC models are used to quantify additional resources consumed due to change in flow conditions. e.g. additional fuel consumed during idling.
Detour traffic may or may not experience changes in flow conditions depending on the detour route capacity and diverted traffic volume. If there is no impact, a simple cents/mile estimates can be used. Otherwise, a detailed traffic analysis is required for detour routes at the network or route level (depending on the impact and site-specific factors).
AAA and ATRI provide simple cents/mile estimates with no due consideration to travel speed, grade, and pavement conditions.
VOC models provide per-mile estimates based on the average speed.
slide 15
Steps for Estimating VOC
- Traffic flowing through work zone
- Estimate speed change cycles and idling time using traffic analysis tools
- Update the unit cost data used in the VOC models
- Estimate cost impact of speed change and idling time using VOC models
- Estimate the total VOC
- Detour traffic
- Determine additional distance traveled due to detour
- Use VOC models to consider speed differential for detour conditions
- For simpler calculations, use AAA/ATRI or equivalent estimates
- Estimate the detour VOC
slide notes
Key message: This slide provides general steps to compute VOC for both WZ through traffic and detour traffic (with no forced flow impacts).
For detours with forced flow impacts, use the steps for WZ through traffic.
slide 16
Steps for Estimating Crash Costs
- Determine the pre-construction crash rate for "influence area"
- Sort by crash severity—3-year to 5-year averages
- Estimate WZ crash rate using a Crash Modification Factor (CMF)
- Typical WZ CMFs can be found at CMF Clearinghouse website
- Use of agency-derived CMFs reflecting local trends is strongly recommended
- Estimate the measure of WZ exposure (typically in MVMT)
- Defined by the WZ influence area, vehicle miles traveled and the WZ duration
- Compute unit cost for crashes
- Human capital & comprehensive costs (by crash severity)
- Crash cost estimates presented in the report FHWA-HRT-05-051
- Use of agency-derived unit costs are recommended
- Human capital & comprehensive costs (by crash severity)
- Compute aggregated WZ crash cost estimates for the project
slide notes
- Crash severity is defined by two commonly used scales: KABCO and AIS.
- K → Fatal; A → Incapacitating; B → Injury evident; C → Injury possible; O → Property damage only
- AIS (0-6 scale): 6 → Fatal; 0 → No injury
- WZCMFs are available on the CMF Clearinghouse website, a repository established and maintained by the FHWA Office of Safety.
- This site contains a compilation of CMFs reported in the literature.
- WZ CMFs are the weak link here. The WZ CMFs are not well studied.
- We have tried to give the best available guidance.
- Note that there are no statistically accepted values of CMFs, as they were found to vary from study to study.
- We refer to the NCHRP Report 627, done by Jerry Ullman and others, to provide guidance on the increased risks related to WZ closure.
- CMFs should account for safety improvement countermeasures to be implemented in the work zone.
- Human Capital Costs → only those hard dollars directly related to crash (e.g. property damage, medical costs)
- Comprehensive → human capital costs PLUS intangible nonmonetary losses to individuals, families and the society
- FHWA-HRT-05-051 "Crash Cost Estimates by Maximum Police-Reported Injury Severity Within Selected Crash Geometries"
- Here again, these are the estimates. We have tried to provide the best available guidance to illustrate the methodology.
- We highly recommend the use of agency-specific estimates reflecting local trends.
slide 17
Steps for Estimating Emission Costs
- Estimate emissions rates (by emission type)
- Static emission factor OR Dynamic instantaneous emission models
- Determine Unit Costs for Emissions
- No consensus on emission costs
- Available unit cost estimates: HERS-ST & Caltrans – typically based on the economic analysis of health impacts caused by emissions
- Determine emission costs
= ∑ (VMT x Emissions Rate x Cost/ton) by Emissions Type
slide notes
- Emission factor relates the amount of pollutants released to the atmosphere with an activity associated with the release.
- Static models calculate emissions based on average operation conditions. These models are generally suitable for large-scale planning studies where the estimations based on average speed are highly accurate. These models may not be accurate enough for speed change cycles in work zone conditions.
- Dynamic models incorporate the effects of instantaneous changes in vehicle operating conditions, and thus making them more suitable for work zone applications.
- Some tools may already have capabilities to estimate emission rates. In such cases, the users should be aware of the type of models (static vs dynamic) used in the tool.
- There is no consensus how to assign a dollar value to quantify the impacts of each pollutant type. Caltrans $/ton estimates were established based on the economic analysis of health impacts caused by emissions.
- Also note that the unit costs vary widely with source-related factors such as population density and land cover of the work zone location. Metropolitan areas with high population densities are affected more strongly by emissions than rural areas.
slide 18
Non-monetary & Qualitative Impacts
- Predict construction noise levels
- Estimate noise levels for various construction operations, e.g., FHWA Roadway Construction Noise Model
- Impacts of local communities and business
- Impact studies, surveys, public outreach and community awareness programs to identify needs and concerns
slide notes
Highway cost allocation study (HCAS) uses noise damage costs but these estimates are for normal operating conditions and do not account for work zone effects.
slide 19
Questions
slide notes
None
slide 20
Application of WZ RUC in MOT Alternate Analysis
slide notes
MOT is a set of coordinated strategies to meet the traffic mobility and safety needs within a work zone.
MOT is a part of Transportation Management Plan (TMP). In addition to MOT, TMP comprises of:
- Transportation operations strategies
- Public information strategies
slide 21
Overview of MOT Alternative Analysis
- WHAT – Process for identifying the best MOT strategy
- WHEN – Recommended when the agency-set performance thresholds are exceeded
- HOW – Comparative evaluation of potential benefits, costs, and constraints
- Requires consideration of both quantitative and qualitative impacts
- Use of decision analysis tools
slide notes
First bullet: what is MOTAA?
Second bullet: When is MOTAA needed? FHWA requires MOTAA for all projects with impacts (or high level of disruption) that are greater than what is considered tolerable based on the respective agency's policy and/or engineering judgment.
Third bullet: What is done in MOTAA? – the potential benefits, costs and constraints associated with each MOT alternative is evaluated
Fourth bullet: What information is required for MOTAA? – the quantitative and qualitative factors of WZ RUC, as well as project-specific factors. There is a need to combine them (quantitative, qualitative and project factors) in a systematic fashion.
Fifth bullet: Are there any tools to perform MOTAA? Any appropriate tool can be used. We illustrate with the Kepner-Tregoe Decision Analysis tool.
slide 22
Kepner-Tregoe Decision Analysis
- Decision analysis tool to make informed choices
- Considers quantitative and qualitative WZ RUC components
- Provides flexibility to make project-specific choices
- Involves the following broad set of actions:
- Identify evaluation criteria and prioritize them
- Identify candidate alternatives
- Evaluate MOT alternatives against set-criteria
- Select the preferred strategy
10-step process illustrated using an example project – Reconstruction of Eastern Avenue Bridge over Kenilworth Avenue in Washington, DC
slide notes
- K-T provides a structured, systematic framework for gathering, organizing, and evaluating information to make informed choices.
- As a multi-criteria decision making approach, it facilitates incorporating quantitative and qualitative factors effectively in the decision making process.
- K-T is not a black box. It provides flexibility to define your own criteria, evaluate against them and select one of your choice. It allows to exercise engineering judgment.
slide 23
Kepner-Tregoe Decision Analysis (cont'd)
- Step 1: Prepare a Decision Statement
- Clearly state of the purpose of decision analysis
- Provides the focus for all other steps that follow
- Sets limits on the range of alternatives considered in the analysis
Kenilworth Avenue Project – Decision Statement
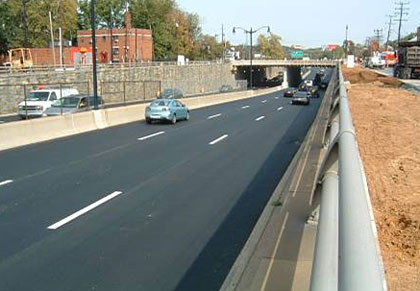
To identify the most effective MOT strategy on mainline Kenilworth Avenue during the reconstruction of bridge piers of the Eastern Avenue bridge.
slide notes
Preparing a decision statement provides resolution to the purpose of the decision analysis.
- Examples → an optimal strategy? Or a low-cost strategy? Or a strategy that provides the least delay costs?
slide 24
Kepner-Tregoe Decision Analysis (cont'd)
- Step 2: Define Objectives
- Define required and desired attributes of the preferred choice
- Specify required attributes as MUST objectives
- GO or NO GO options
- All attributes must be satisfied; otherwise alternative is eliminated
- Specify desired attributes as WANT objectives
- Numerical weights to indicate relative importance
- Screen for interdependence (high correlation) among objectives (e.g. average delay time vs delay costs)
"the MUSTS decide who gets to play, but the WANTS decide who wins."
slide notes
Objectives are the criteria for the decision.
slide 25
Kepner-Tregoe Decision Analysis (cont'd)
Kenilworth Avenue Project – MUST objectives
- Does an MOT option satisfy constructability requirements? Limited work zone space on mainline Kenilworth Avenue – a key constraint
- Are there any alternate routes available to accommodate full diversion?
Kenilworth Avenue Project – WANT objectives
- Mobility costs – the goal is to minimize travel delay costs, VOC and WZ exposure
- Spillback congestion – traffic backups may cause spillback on nearby routes
- Crash costs – larger influence area and longer exposure periods
- Inconvenience to local residents – bus access and parking along service roads
- Emergency response and school transportation
- Pedestrian access – Eastern Avenue used by many pedestrians
- Construction duration – calendar day required for project completion
- Traffic control costs – expenditure for traffic control devices, related roadway improvements (to maintain traffic), and public information strategies
slide notes
This slide lists the MUST and WANT objectives selected for the Kenilworth Avenue project.
slide 26
Kepner-Tregoe Decision Analysis (cont'd)
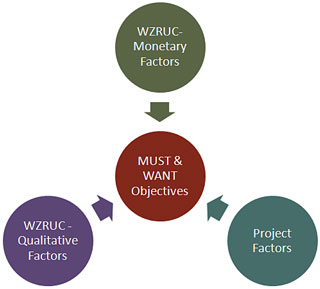
- Step 2: Define Objectives – Focus on WZ RUC
- WZRUC- Monetary Factors
- Mobility costs
- Crash costs
- Construction duration
- Alternate detour routes
- WZRUC - Qualitative Factors
- Inconvenience to local residents
- Emergency response and school transportation
- Pedestrian access
- Project Factors
- Constructability
- Traffic control costs
- WZRUC- Monetary Factors
slide notes
Key message: All MUST and WANT objectives were defined using quantitative and qualitative work zone factors and project factors.
slide 27
Kepner-Tregoe Decision Analysis (cont'd)
- Step 2: Define Objectives
- High correlation among objectives may lead to biased analysis
- Minimize interdependency

slide notes
Key Message: Ensure that objectives are not highly interdependent. Interdependency can be minimized by:
- Sensitivity analysis to scan for correlation
- Evaluate the degree of correlation & logical dependency
- Avoid defining objectives at both aggregate and component level
- Use engineering judgment
In the example shown, focus is on the link: (from) work zone travel speed → delay time → delay cost → daily WZ RUC.
Use judgment in eliminating correlated objectives.
e.g. delay time vs delay costs
e.g. delay time vs crash costs/risks
Both are correlated somehow. You got to make a decision whether to include both or not.
slide 28
Kepner-Tregoe Decision Analysis (cont'd)
- Step 3: Assign Weights to WANT Objectives
- Assign weights to WANT objectives
- Use a scale of 1 (least preferable) to 10 (most preferable)
- Weighting should reflect agency policies and project needs
- Common weighting mistakes to avoid:
- Too many high weights
- Too many low weights
- Biased weighting
- Assign weights to WANT objectives
| WANT Objective | Weights |
|---|---|
| Mobility costs | 10 |
| Spillback on nearby roadways | 10 |
| Crash costs | 10 |
| Inconvenience to local residents | 5 |
| Emergency response and school transportation | 4 |
| Pedestrian access | 5 |
| Construction duration | 8 |
| Traffic control costs | 6 |
slide notes
Too many high or low or biased weights may skew your analysis.
slide 29
Kepner-Tregoe Decision Analysis (cont'd)
- Step 4: Identify and list all potential MOT alternatives
Kenilworth Avenue Project – Potential Alternatives
- MOT Option 1 – close one of three lanes in each direction on mainline Kenilworth Avenue
- MOT Option 2 – close one of three lanes in each direction on mainline Kenilworth Avenue and supplement with two-lane service roads in each direction
- MOT Option 3 – close two of three lanes in each direction on mainline Kenilworth Avenue and supplement with two-lane service roads in each direction
- MOT Option 4 – full closure of this segment of Kenilworth Ave and divert traffic through detour
- MOT Option5 – close one of three lanes in each direction during nighttime only
slide notes
Note that we have defined the evaluation criteria first and then identify the candidate alternatives. You don't want to select an alternative and build up a case to support your decision – a common fallacy in our cognitive thinking.
slide 30
Kepner-Tregoe Decision Analysis (cont'd)
- Step 5: Summarize the findings of work zone impact assessment:
- Constructability
- Detour Alternatives
- Service Roads
- Pedestrian Access
- Emergency Response and School Transportation
- Construction Duration
- Traffic Control and Improvement Costs
- Mobility Impacts
- Crash Risks
slide notes
Summarize all the important findings from the work zone impact assessment process. These findings provide the foundation for the alternative evaluation, which will be done in the following steps.
slide 31
Kepner-Tregoe Decision Analysis (cont'd)
- Step 6: Evaluate potential alternatives against each MUST objective
- Eliminate an alternative that fail to satisfy at least objectives – only those satisfy all objectives are considered as feasible ones
| MUST Objective | MOT Options | ||||
|---|---|---|---|---|---|
| 1 | 2 | 3 | 4 | 5 | |
| Does an MOT option satisfy constructability requirements? | Yes | Yes | Yes | Yes | No |
| Are there any alternate detour routes to accommodate full diversion of Kenilworth Avenue traffic? |
Yes | Yes | Yes | No | Yes |
slide notes
If an alternative fails to meet at least one objective, it is then eliminated.
In this example, Option 4 was eliminated as no alternative detour routes had capacity to accommodate full diversion of Kenilworth Avenue traffic and Option 5 failed to meet constructability requirements as nighttime only closures were unfeasible for cast in-place bridge pier construction.
slide 32
Kepner-Tregoe Decision Analysis (cont'd)
- Step 7: Evaluate against WANT objectives
- Assign a score on a scale of 1 to 10 for each alternative against each WANT objective
| WANT Objective | MOT Options | ||||
|---|---|---|---|---|---|
| 1 | 2 | 3 | 4 | 5 | |
| Mobility costs | 2 | 10 | 4 | Not considered for further analysis since they did not meet MUST objectives… … |
|
| Spillback on nearby roadways | 2 | 10 | 4 | ||
| Crash costs | 4 | 8 | 6 | ||
| Inconvenience to local residents | 10 | 3 | 3 | ||
| Emergency response and school transportation | 5 | 7 | 5 | ||
| Pedestrian access | 8 | 4 | 4 | ||
| Construction duration | - | - | - | ||
| Traffic control costs | - | - | - | ||
slide notes
Score each alternative based on the findings of work zone impact assessment.
slide 33
Kepner-Tregoe Decision Analysis (cont'd)
- Step 8: Calculate the weighted scores
- Multiply the weight of an objective with the alternative score
- Compute the total weighted score for each alternative
- Select the alternative with the highest weighted score as the tentative choice
Tentative choice: Option 2
| WANT Objective | Weight | MOT Options | ||
|---|---|---|---|---|
| 1 | 2 | 3 | ||
| Mobility costs | 10 | 20 | 100 | 40 |
| Spillback on nearby roadways | 10 | 20 | 100 | 40 |
| Crash costs | 10 | 40 | 80 | 60 |
| Inconvenience to local residents | 5 | 50 | 15 | 15 |
| Emergency response and school transportation | 4 | 20 | 28 | 20 |
| Pedestrian access | 5 | 40 | 20 | 20 |
| Construction duration | 8 | - | - | - |
| Traffic control costs | 6 | - | - | - |
| Total weighted score | 190 | 343 | 195 | |
slide notes
Multiply weights (from Step 3) and score (from Step 7) for each alternative and compute the total weighted score.
Why call it a tentative choice? Because there may be risks involved in selecting this alternative, and those risks could warrant its exclusion.
slide 34
Kepner-Tregoe Decision Analysis (cont'd)
- Step 9: Evaluate adverse consequences separately for each alternative
- Identify potential risks
- Determine the probability of occurrence
- Determine the severity of impacts
- Evaluate the adverse consequences of selecting an alternative
- Identify low-risk and high-risk choices.
| Adverse Consequence |
MOT Option 1 | MOT Option 2 | MOT Option 3 | |||
|---|---|---|---|---|---|---|
| Probability | Severity | Probability | Severity | Probability | Severity | |
| Emergency Evacuation |
LM | HM | LM | HM | LM | M |
No high-risk options were identified.
slide notes
A potential risk is always associated with the probability of occurrence and the severity of impact.
Each alternative is evaluated individually. No comparative assessment is made.
You can do it in two ways: Begin with the tentative choice, analyze its risks and make a decision. If the tentative choice is excluded, then continue with the second best choice. Or, you can assess them all individually.
slide 35
Kepner-Tregoe Decision Analysis (cont'd)
- Step 10: Select the Preferred MOT Strategy
- List and rank the total weighted score of each alternative
- Summarize the results of risk evaluation
- Evaluate the high-risk choices for elimination or possible modifications
- Re-evaluate modified alternatives, if required
- Select the preferred choice
slide notes
If the tentative choice is not identified as high risk , you can select it as the preferred strategy. Otherwise, there are two options: (1) eliminate (2) modify.
If the tentative choice is modified, you can re-do the analysis with the modified alternative or go ahead with the selection.
Engineering judgment is the key in making any decisions relating to eliminating, reviewing, and/or re-evaluating high-risk choices.
slide 36
Kepner-Tregoe Decision Analysis (cont'd)
| Alternative | Description | Total Weighted Score |
Total Adverse Consequence Score |
Rank |
|---|---|---|---|---|
| Option 1 | Close one of three lanes in each direction on mainline Kenilworth | 182 | Low-risk | 3 |
| Option 2 | Close one of three lanes in each direction on mainline Kenilworth and supplement with two-lane service roads per direction | 327 | Low-risk | 1 |
| Option 3 | Close 2 of 3 lanes in each direction on mainline Kenilworth and supplement with two-lane service roads per direction | 183 | Low-risk | 2 |
| Option 4 | Full closure of this segment of Kenilworth and divert traffic through detour | Eliminated | - | - |
| Option 5 | Close one of three lanes in each direction during nighttime only. | Eliminated | - | - |
slide notes
None
slide 37
Questions
slide notes
None
slide 38
Application of WZ RUC in Contracting/Project Delivery
slide notes
This part of the presentation has three parts:
- To first understand the relationship between WZ RUC and project completion time and understand its role in contract administration.
- Identify the need for schedule acceleration (to minimize WZ RUC) and select an appropriate strategy based on work zone impacts and project-related factors.
- Establish the time-related contract provisions such as I/D amount and lane rental fee.
slide 39
WZ RUC vs Project Completion Time
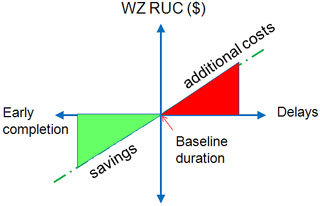
slide notes
- WZ RUC is directly linked to project completion time.
- A direct consequence of construction delay is the adverse work zone road user impacts
- Longer construction time prolongs WZ adverse impacts, and hence, results in increased RUC
- Shorter construction time minimizes WZ adverse impacts, and hence, results in RUC savings
slide 40
Role of WZ RUC in Contracting/Project Delivery
- Use of Liquidated Damages clause in traditional contracting:
- Partially effective in enforcing project completion time
- No incentives to contractor for early completion
- Significance of Milton vs State of Alabama case
- Relating daily incentive/disincentive (I/D) rate to daily WZ RUC
- Applications of WZ RUC
- Justifying the need for schedule acceleration
- Selecting the most appropriate project delivery strategy
- Establishing time-related contract provisions (e.g. I/D)
slide notes
Liquidated damages are imposed to recover the additional agency oversight costs incurred due to construction delay. FHWA Contract Administration Core Curriculum (CACC) Manual allows inclusion of WZ RUC.
However, the experience shows that the use of Liquidated damage clause is only partially effective in enforcing project completion time. Moreover, it does not provide any incentives to the contractor for completing ahead of schedule. Therefore, there is a need for such strategies to encourage early completion. One prominent factor for early completion is to minimize road user costs.
Second, there is a significant limelight on the Milton vs State of Alabama case. This case is described briefly in the CACC manual. The underlying purpose to mention this case is the Alabama Supreme Court decided against the Alabama highway department citing that the State did not adequately demonstrate how the contract time was established nor how the daily I/D rate was related to road user costs, and therefore voided the disincentive amount levied against the contractor for construction delay.
Thus, considering the importance of WZ RUC in contract administration, it can be applied in two areas:
- To justify the need for schedule acceleration and select an appropriate strategy to achieve early completion based on various project and work zone impact related factors.
- Establishing time-related contract provisions such as computing I/D or lane rental fee.
slide 41
Justifying the Need for Schedule Acceleration & Selection of Appropriate Project Delivery Strategies
slide notes
Not all projects need to be completed early. If there is a need, the decision should be taken early in the project development process. After justifying the need for project acceleration, an appropriate strategy should be selected based on the needs (i.e. anticipated work zone impacts and project-related factors). Each project may have a unique set of needs.
This subsection provides guidance on establishing the need for schedule acceleration and strategy selection.
slide 42
Accelerating Project Schedule
- Establish the need for schedule acceleration
- Expediting project completion costs money
- Not required for every project
- Identify the need based on project conditions and work zone road user impacts
- Select a project delivery method
- Select a schedule-focused contracting method
slide notes
It is a three-step process.
First, establish the need.
Second, select a project delivery method – design bid build, design-build or CMGC.
Why select a project delivery method? Selecting the project-delivery method defines the role of the agency. It defines the contractual relations, roles, and responsibilities of the entities involved in a project. For example, the agency may identify a need for project acceleration. While it views accelerated construction as a viable choice, it may not have prior experience or in-house capabilities to achieve the final goal i.e. complete early using accelerated construction. Here comes the need for a non-traditional project delivery – CMGC or design-build.
Third, select a schedule-focused contracting strategy.
slide 43
Step 1: Need for Schedule Acceleration Typical Questions
- Heavy traffic volume?
- Located in urban area?
- Commuter route?
- Network level impacts?
- Early completion required?
- Time-sensitive project?
- Located in tourist or economically sensitive area?
- Lacks viable detour alternatives?
- Political interests?
- Affects local community and business?
- Safety issues for construction workers?
- Safety issues for motorists?
slide notes
Here are some typical questions. A simple "YES" to most of these questions can justify the need for schedule acceleration.
slide 44
Available Strategies
Project delivery
- Design-bid-build
- Design-build (DB)
- Construction manager/general contractor (CMGC)
Construction techniques
- Cast in-place
- Accelerated technique
Contracting methods
- Liquidated damages
- Incentive/disincentive (I/D) for early completion
- A+B bidding (with I/D)
- Lane rental
- No-excuse incentives
- Interim completion dates (with or without I/D)
- Liquidated savings
slide notes
Here is a list of available strategies for consideration.
slide 45
Step 2: Select a Project Delivery Method
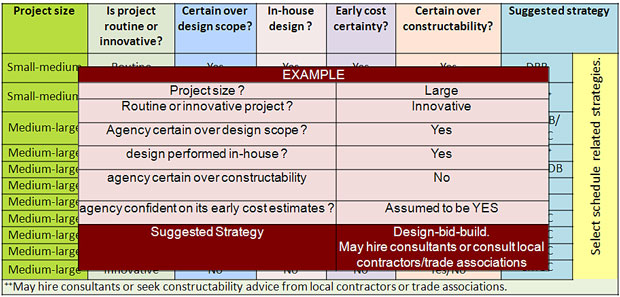
- Decision matrix focuses only on shortening completion time
- Actual selection may require more comprehensive evaluation
slide notes
Select a project delivery method based on the following factors:
- What is the project size? Small, medium or large?
- Early contractor involvement is more suitable for complex projects
- Is project routine or innovative?
- Design-bid-build is more suitable for routine projects
- Is agency certain over design scope?
- Design-build can be more expensive with change orders
- CMGC is suitable if the agency is not certain over design scope
- Is design performed in-house?
- Design-build is suitable if the design is not performed in-house
- Is agency certain over constructability?
- Hire consultants or consult with local contractors/industry
- Is agency confident on its early cost estimates?
- CMGC is suitable if the agency is not certain over cost estimates
slide 46
Step 3: Select a Contracting Method
slide notes
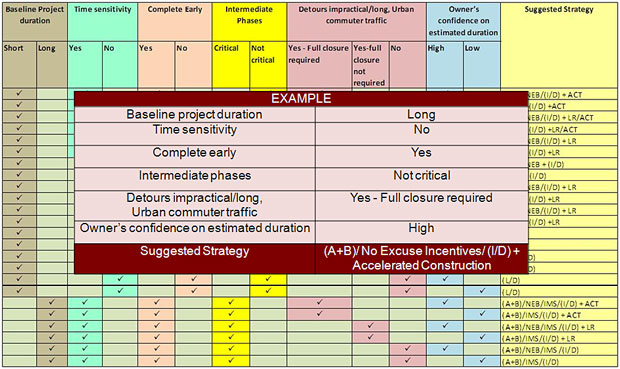
- Is early completion required? and/or Is project time-sensitive?
- Any form of I/D can be effective
- Is project duration short or long?
- A+B bidding can be effective for long-term projects
- Does the project involve critical intermediate or multiple phases?
- A+B bidding, no-excuse incentives, and interim milestones can be effective to complete critical phases of a project
- Are detours long, impractical, or unavailable? Does the roadway carry urban commuter traffic?
- Lane rentals can be effective when detours are unfeasible
- Is full-closure a viable alternative?
- Accelerated construction can be effective when full closure is inevitable
- Is the agency confident on its schedule estimates?
- No-excuse incentives are not effective when the agency is not confident about the estimated project duration
slide 47
Establishing Time-related Contract Provisions
slide notes
This section illustrates how to establish time-related contract provisions such as I/D amount and lane rental fees.
slide 48
WZ RUC and Contract Provisions
- Incentive/Disincentives
- Daily I/D = Discount Factor * Daily WZ RUC
- (include agency construction oversight costs)
- A+B bidding
- Bid value = (A) + (B x Daily WZ RUC)
- Lane Rental
- Rental fee = WZ RUC for actual closure period – WZ RUC for allowable closure period
slide notes
None
slide 49
Applying WZ RUC in I/D Computation
- Combine "Time-Cost Tradeoff" & "Time is Money" concepts
- Schedule acceleration incurs additional costs to contractor
- Labor, materials and equipment
- If incentive < contractor cost of acceleration?
- If incentive > WZ RUC?
- Incentive < acceleration costs?
- I/D Equations
Cost of Acceleration (CA) ≤ I/D ≤ WZ RUC
I/D = Discount Factor * WZ RUC
slide notes
- Project acceleration requires additional labor, materials, and equipment and therefore costs more money.
- To provide real incentive to the contractor, the incentive should be adequate enough to cover the contractor costs or acceleration.
- If the incentive exceeds the WZ RUC savings (including savings in agency's construction oversight costs), there is really no justification for schedule acceleration.
- Therefore, I/D should be balanced.
- Most agencies (e.g. New Jersey) apply discount factor to determine I/D based on WZ RUC estimates.
slide 50
Discount Factors in I/D Computation
- Portion of WZ RUC savings shared or recovered
- Range of discount factors:
- 0.1 to 1.0 ; 0.2 to 0.5 (typically used)
- How to determine the discount factor?
- Market conditions
- Confidence on the accuracy of WZ RUC estimates
- Level of project acceleration required
- Agency costs - WZ RUC – Total incentives cannot exceed 5% of project cost.
- Is there an appropriate discount factor?
- Adequate to stimulate schedule acceleration?
- Adequate to cover additional contractor costs?
slide notes
- Discount factor is the portion of RUC savings shared by the agency with the contractor for early completion or recovered by the agency for late completion.
- The rationale behind the selection of discount factor is largely unknown or not documented. It is typically an owner agency's management decision by taking several factors into account.
- It can be seen as a way to match the value of WZ RUC with the agency costs, especially if the WZ RUC estimates are very high. Also note that there is a federal requirement that the total project incentive amount is capped at 5 percent of the total contract amount.
- So, is there a way to determine a discount factor that is adequate enough to stimulate schedule acceleration? → use sensitivity analysis.
slide 51
Sensitivity of Discount Factors
slide notes
The purpose of this slide is to demonstrate the effectiveness of discount factors.
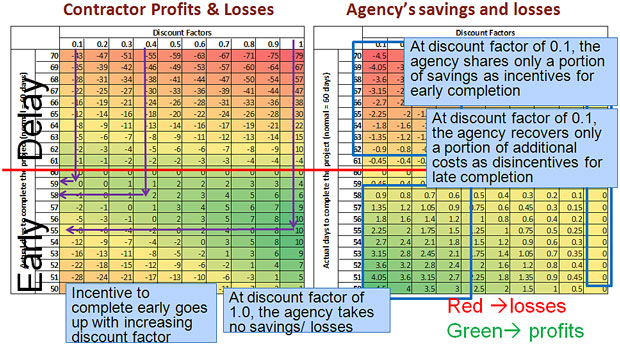
Basically we took a hypothetical project scenario. We utilized the cost model (a polynomial model) developed by Shr et al (TRB year 2000). The authors developed this model using the data obtained from Florida DOT projects. Assuming the baseline completion duration at 60 days, we calculated profits and losses for combinations of various early & late completion scenarios and discount factors. The matrix on the left shows contractor profits and losses, and on the right is the agency savings and losses matrix. Red indicates losses and green indicates profits. The profit and loss magnitude increases with hue density.
Here are the key observations:
- At discount factor of 1.0, the agency takes no savings/losses
- At discount factor of 0.1, the agency recovers only a portion of additional costs as disincentives for late completion
- At discount factor of 0.1, the agency shares only a portion of savings as incentives for early completion
- Incentive to complete early goes up with increasing discount factor – in fact no incentive at a discount factor of 0.1, 2 days early at a DF of 0.4 and 5 days early at a DF of 1.0. To achieve any earlier completion, the incentive should cover the contractor cost of acceleration or would exceed WZ RUC savings.
slide 52
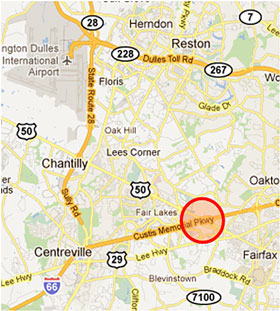
Illustrative Example: Concrete Pavement Rehabilitation on Interstate-66, Fairfax County, Virginia
- Highways for Life demonstration project
- Urban interstate
- heavy commuter traffic
- ~ 90,000 vpd (one-way)
- Three lanes + auxiliary lane for peak hours
- Allowable lane closure:
- Three lane closure: 10pm-5am
- Two lane closure: 9pm-5am (not considered for illustration)
- Used RealCost for illustration
slide notes
Here is a brief description of the case study. The purpose is to illustrate the computation of lane rental fee and daily I/D.
slide 53
Lane Rental Computation
- Lane rental fee for a given closure period
- daily WZ RUC (actual closure period)
MINUS daily WZ RUC (allowable closure period)
- daily WZ RUC (actual closure period)
- Negative differences indicate no adverse effect (no fee)
- Include construction engineering costs
- Adjusted using a discount factor
slide notes
None
slide 54
I-66 Pavement Rehabilitation
Lane Rental Fee Computation – Three lane Closure
| Lane Closure Timings | Daily WZ RUC for the given closure period |
Difference in daily WZ RUC between actual and allowable closure periods |
Estimated maximum queue length (miles) |
Estimated maximum delay time (minutes) |
||
|---|---|---|---|---|---|---|
| Condition | Closed | Opened | ||||
| Early Closure |
7 pm | 5 am | $1,590,479 | $1,518,188 | 16.7 | 246.5 |
| 8 pm | 5 am | $637,237 | $564,946 | 9.4 | 140.3 | |
| 9 pm | 5 am | $264,196 | $191,904 | 5.4 | 81.3 | |
| Allowable Closure (baseline) |
10 pm | 5 am | $72,291 | $0 | 2.2 | 35.6 |
| Failure to Open |
10 pm | 6 am | $72,511 | $220 | 2.2 | 35.6 |
| 10 pm | 7 am | $89,828 | $17,537 | 2.2 | 35.6 | |
| 10 pm | 8 am | $169,696 | $97,405 | 5.7 | 65.2 | |
| 10 pm | 9 am | $350,813 | $278,522 | 13.1 | 138.8 | |
slide notes
Here is the illustration of lane rental fee.
The first three columns show lane closure condition. The allowable closure is between 10 pm and 5 pm.
The fourth column is the daily WZ RUC estimated using RealCost for the given closure period.
The fifth column is the additional WZ RUC resulting either from early closure (i.e. before 10 pm) or failure to open (i.e. after 5 am) – when compared to the allowable closure period.
The sixth and seventh column is the estimated max queue length and delay time for the given closure period. These measures are an indicator of anticipated WZ impacts.
slide 55
I-66 Pavement Rehabilitation
Lane Rental Fee Computation – Three lane Closure (cont'd)
| Lane Closure Timings | Difference in daily WZ RUC between actual and allowable closure periods |
VDOT Lane Rental Fee |
Lane Rental Fee | ||||
|---|---|---|---|---|---|---|---|
| Condition | Closed | Opened | DF=0.25 | DF=0.5 | DF=1.0 | ||
| Allowable Closure (baseline) |
10 pm | 5 am | $0 | $0 | $0 | $0 | $0 |
| Failure to Open |
10 pm | 6 am | $220 | $9,000 | $55 | $110 | $220 |
| 10 pm | 7 am | $17,537 | $28,000 | $4,384 | $8,769 | $17,537 | |
| 10 pm | 8 am | $97,405 | $48,000 | $24,351 | $48,703 | $97,405 | |
| 10 pm | 9 am | $278,522 | $68,000 | $69,631 | $139,261 | $278,522 | |
- No one-to-one comparison is made.
- Computation tools were different.
- Unit costs were not the same.
- Construction engineering costs were not included.
- No information available on VDOT's discount factors.
slide notes
This slide compares the lane rental fee estimated using RealCost and VDOT established fee for this project.
VDOT fee schedule is provided for illustrative purpose only. No one-to-one comparison should be made because different assumptions were used.
slide 56
I-66 Pavement Rehabilitation
If this project were to use A+B bidding?
- Key assumptions:
- 3-lane closure
- Bid days (B) = 44 days
- Daily RUC = $72,291
- Discount Factor = 0.25
- I/D= 0.25 * daily RUC
| Case | Project Completed in (days) |
Days saved/ delayed |
I/D |
|---|---|---|---|
| Early Completion |
39 | 5 | $90,364 |
| 40 | 4 | $72,291 | |
| 41 | 3 | $54,218 | |
| 42 | 2 | $36,146 | |
| 43 | 1 | $18,073 | |
| Baseline | 44 | 0 | $0 |
| Delay | 45 | -1 | -$18,073 |
| 46 | -2 | -$36,146 | |
| 47 | -3 | -$54,218 | |
| 48 | -4 | -$72,291 | |
| 49 | -5 | -$90,364 |
slide notes
If this project were to use A+B bidding, how much would the I/D for early/late completion.
Assume that the baseline duration is 44 days and a discount factor of 0.25. Early completion would attract an incentive for the contractor and vice versa.
slide 57
Application of WZ RUC in Benefit-Cost Analysis
slide notes
The next application area is the use of WZ RUC in benefit-cost analysis.
slide 58
WZ RUC in Benefit-Cost Analysis
- To evaluate the economic efficiency of a decision
- Compare costs & benefits, e.g. economic value of construction innovation
- How an alternative compare with others, e.g. accelerated construction vs cast in-place techniques
- Agency costs & WZ RUC
- Agency Costs
- Preliminary design and engineering
- Construction costs
- Mobilization
- Construction engineering
- Traffic control
- Law enforcement
- WZ RUC
- Delay costs
- Vehicle operating costs
- Crash costs
- Emission costs
- Agency Costs
slide notes
Key Message: This slide provides an overview of WZ RUC applications in benefit-cost analysis.
slide 59
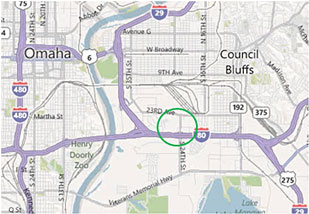
Illustrative Example: Improvements to the 24th Street–I-29/80 Interchange in Council Bluffs, Iowa
- Accelerated vs cast-in place construction
- Estimated construction duration
- Cast in-place → 426 days (two seasons)
- Accelerated → 175 days (less than one season)
- Cost impacts of accelerated construction techniques
- Higher agency costs for design, construction and contractor incentives
- Savings in WZ RUC
| Cost Category | Cast In-place Scenario |
Accelerated Construction Scenario |
Savings |
|---|---|---|---|
| Agency costs | $11,128,864 | $12,506,262 | ($1,377,398) |
| WZ RUC | $3,480,756 | $1,087,147 | $2,393,609 |
| Net Savings | $1,016,211 |
Use of accelerated construction techniques showed an 8 percent benefit (first cost basis) over traditional methods
slide notes
Iowa DOT identified a need for early completion based on work zone user impacts. The agency weighed in the benefits and costs of using accelerated construction techniques over conventional cast-in-place construction.
The selection of cast in-place would have taken 2 construction seasons (426 days), while the use of accelerated construction would have taken only 1 season (213 days). The contractor ended up completing 38 days ahead of schedule. (i.e. 175 days).
In this project, the use of accelerated techniques resulted in higher agency costs for design, construction and incentives, while there was a substantial savings in WZ RUC costs.
slide 60
Questions
slide notes
None
slide 61
WZ RUC Reference Documents
- Important Upcoming Documents
- Work Zone Road User Costs: Concepts and Applications, FHWA-HOP-12-005
- To be Released December 2011
- TAT Vol. XII: Work Zone Traffic Impact Analysis – Applications and Decision Framework
- To be Released December 2011
- Work Zone Road User Costs: Concepts and Applications, FHWA-HOP-12-005
slide notes
The document will include section on RUC using the material from other base document.
slide 62
Contact Information:
Jawad Paracha
Work Zone Safety & Mobility Team
FHWA Office of Transportation Operations
jawad.paracha@dot.gov
Jagannath Mallela
Principal Engineer
ARA, Inc.
jmallela@ara.com
Thank You!
slide notes
None