Comprehensive Truck Size and Weight Limits Study: Pavement Comparative Analysis Technical Report
Chapter 2: Selection of Pavement Sections
2.1 Key Data and Models Used in the Analysis
Performance Distress Target Inputs
The pavement distress prediction targets were initially selected as the threshold values presented in the AASHTO MEPDG-1 Manual of Practice (2008). A 90 percent reliability level was used in the preliminary analyses in this phase of the study to compare distress predictions in the four geographic locations as an initial check on prediction data quality. The initial International Roughness Index (IRI) of 65 in/mile and terminal IRI of 160 in/mile were used for both pavement types. The damage thresholds for both the flexible and rigid pavements considered in the study are presented in Table 1.
Note: All of the analyses were conducted with a pavement construction date of June 2015.
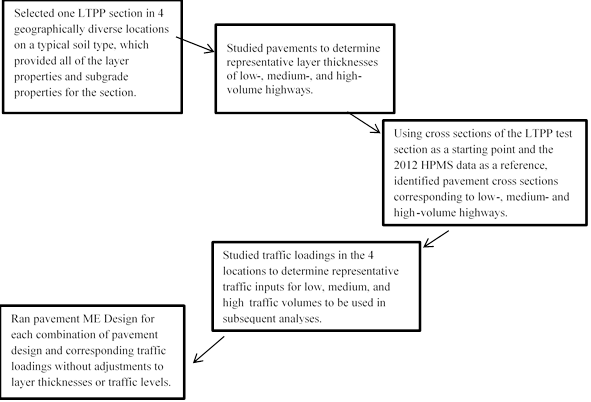
Figure 1 provides an overview of the general approach used in each geographic location for each pavement type:
Selection of Pavement Sections
The approach presented in Figure 1 is intended to allow for reasonable extrapolation of these representative sections to the Nation’s roadways with increased confidence that the representative traffic and representative pavement designs were matched independently. The study used representative pavement designs for low, medium, and high volumes on highways upon which the majority of truck traffic will be traveling.
Figure 1: Overview of Sample Pavement Section Selection Approach
The LTPP database, along with the sites included in the field calibration studies used in the four States representing the geographically diverse locations in the United States, were reviewed to identify flexible and rigid pavement sections. These sections were identified as being in the general areas of Columbus, Ohio; Jackson, Mississippi; Phoenix, Arizona; and both Wasatch County and Nephi, Utah. A listing of the original sections that formed the baseline for all further analysis for the full matrix is summarized in Table 2. These sites were selected only to serve as a starting point in determining the impact of different truck traffic levels.
Using the LTPP test section cross sections as a starting point and the FHWA 2012 HPMS data as a reference, the pavement cross sections corresponding to low-, medium-, and high-volume highways were identified. In doing so, a number of alternative cross sections were explored in order to ensure that the selected cross sections encompass the range of pavements on the National Highway System (NHS) from a standpoint of both layer thicknesses and expected performance.
All of the Pavement ME Design® software inputs for these sections were provided by Applied Research Associates (ARA), including the materials information from the LTPP database and local State calibration factors derived during implementation of the Pavement ME Design® software in those States. As noted above, the inputs from these LTPP sites included in Table 2 were only used as a starting point for the detailed analyses.
Analysis of Truck Traffic Volume Adjustments
To estimate truck traffic levels, the States were grouped by their geographic location. The average daily truck traffic (ADTT) estimates were calculated for both Interstate and Other NHS arterial routes for each State as well as for the collection of all States geographically grouped near one of the four analysis locations. These estimates were based on a combination of travel estimates developed for this study and estimates of highway miles by State and functional class published in the FHWA 2011 HM-20 table.
Interstate Truck Traffic Volumes
The Interstate truck traffic values (in trucks per day) were defined by the following procedure:
- Medium-volume (MV) Interstate ADTT levels were derived from the average of all Interstate highways within a grouping of States near each of the four locations; and,
- High-volume (HV) Interstate ADTT levels were derived from the highest observed State average within a grouping of States near each of the four locations.
Clearly, using State averages results in high-volume sections that together do not cover the full range of truck travel variation within a given State or grouping of States near each of the four locations, but the medium-volume ranges represent the mean values of truck travel, given their derivation. A better approach might be to gather truck volume data from a large number of highway sections, but such data were not available for this study, so the State average variation approach served as a plausible substitute.
Other NHS Arterial Truck Traffic Volumes
The USDOT study team derived the low-volume other NHS arterial ADTT values from the average of the combined Other NHS arterial highways within a grouping of States near each of the four locations.
Other traffic inputs were determined by averaging travel data within a grouping of States near each of the four locations, including the vehicle class, axle load weight distributions, axles per truck, etc. A more comprehensive table of the average truck traffic levels organized by the geographic grouping and State, from which Table 3 was derived, is included in Appendix G.
Vehicle class and axle weight distributions used in the pavement analysis and throughout the study were derived from weigh-in-motion (WIM) and vehicle classification data from two sources: FHWA’s Office of Highway Policy Information and the LTPP WIM data provided by FHWA’s Office of Infrastructure Research and Development as described in Section 1.3 of the Data Acquisition and Technical Analysis Report. The CTSW Study’s VMT estimates by vehicle class, operating weight distributions by vehicle class, and axle weight distributions by operating weight group and vehicle class for each geographic location were condensed into the format required for direct use by Pavement ME Design® software.
Establishment of Distress Prediction Levels for Sample Pavement Sections
In selecting the performance criteria for use in the Pavement ME Design® software, all predictions were analyzed at the mean predicted level over a 50-year analysis period. Table 4 presents the levels of distress prediction defined as threshold criteria for the assessment of all pavement types.
These are similar to those values used by highway agencies for determining when major rehabilitation (e.g., overlays, retexturing, reconstruction, etc.) is needed. Agencies also use criteria that are structure-related or use a combination of criteria related to safety, comfort, or ride-ability.
In order to conduct a pavement structural analysis of this breadth, a number of engineering assumptions and an analytical scope were defined, and these are presented in Table 5. Other inputs such as the depth to groundwater table and soil type and properties are included in Appendix D.
LV = low-volume Other NHS. MV = medium-volume Interstate. HV = high-volume Interstate.
Selection of New Flexible Pavement Sections
Each of the new flexible pavement sections selected for this study were analyzed at the design targets recommended in the MEPDG Manual of Practice, as described above. The mixture properties and other climatic and material properties (e.g., for the base and subgrade) were based on the original LTPP calibration data files for each of the four States. The distress and IRI calibration coefficients were locally calibrated in the States from which the initial structures were selected. The truck volumes, vehicle class distributions, and axle weight distributions were applied per the method previously described.
Data from the 2012 Highway Performance Monitoring System (HPMS) were consulted to determine the appropriate pavement HMA and PCC surface thickness based on roadway type (Interstate vs. other NHS arterial) for each geographic location. The flexible pavement cross-sections to be used in the structural analyses are presented in Table 6. The full dataset from the HPMS is presented in Appendix H.
Schematic diagrams that present the information on flexible pavement structural sections in Table 6 are included in Appendix I of the report.
Selection of New Rigid Pavement Sections
The four new rigid pavement sections were analyzed at the design targets recommended in the MEPDG Manual of Practice (2008). The mixture properties and other climatic and material properties (e.g., for the base and subgrade) were carried forward from the original LTPP calibration files for each of the four States.
The same process of consulting the HPMS data was applied for the selection of rigid pavement surface thicknesses, presented in Table 7.
Schematic diagrams that present the information on rigid pavement structural sections in Table 7 are included in Appendix J of the report.
2.2 Summary and Conclusions
The structural profiles for each of the sample pavement sections for each geographic location were selected by considering the range of asphalt and concrete pavement thicknesses presented by roadway functional classification (for both the Interstate and Other NHS categories) in the FHWA HPMS database. The average base case truck traffic levels for each geographic location and pavement section were generated for three different highway conditions (high-volume Interstate, medium-volume Interstate, and low-volume Other NHS) that are representative of the National Network.
In conclusion, the outlined approach is intended to provide for a reasonable structural analysis of the most common types of existing pavements using appropriate representative baseline truck traffic volumes.
2.3 References
American Association of State and Highway Transportation Officials, Mechanistic-Empirical Pavement Design Guide, Interim Edition: A Manual of Practice, Washington, D.C., July 2008.
Applied Research Associates, Guide for Mechanistic-Empirical Design of New and Rehabilitated Pavement Structures, Final Report - Part 2 Design Inputs, Chapter 2 Materials Characterization, March 2004, available online: http://onlinepubs.trb.org/onlinepubs/archive/mepdg/Part2_Chapter2_Materials.pdf (accessed November 6, 2013).
You may need the Adobe® Reader® to view the PDFs on this page.
previous | next