Behavioral/Agent-Based Supply Chain Modeling Research Synthesis and GuideCHAPTER 3. FREIGHT MODEL DATA AND RESOURCESAcquiring the data and finding the resources required to support a behavioral supply chain model is often challenging, given the privacy and confidentiality issues surrounding supply chain data. This chapter describes the data required to support such a model. It also describes the data and resources assessment for model development. COMMON DATASETSMany data sources exist for estimating, calibrating, validating, and forecasting a freight modeling system. Advanced freight travel demand modeling in the United States often uses publicly available data sources to model freight movements. Publicly available data (at no cost) will require some level of effort to process and clean before it is available for use. This section describes common data sources used by public agencies to build advanced freight travel demand models. Commodity Flow DataMany models rely on Freight Analysis Framework (FAF) data as input. FAF is a publicly available commodity flow dataset used in supply chain models. The FAF integrates data from several sources to create a comprehensive picture of freight movement among states and major metropolitan areas by all modes of transportation. With data from the 2012 Commodity Flow Survey (CFS) and additional sources, FAF version 4 (FAF4) provides estimates for tonnage, value, and domestic ton-miles by region of origin and destination, commodity type, and mode for 2015 (the most recent year) and forecasts through 2045. Also included are state-to-state flows, summary statistics, and flows by truck assigned to the highway network for 2012 and 2040. FAF flows are also used as control totals for freight moving into and out of the region being modeled and for projected freight movements to exterior zones outside of the modeling region. The structure of the FAF consists of 132 CFS regions (or FAF zones) divided in the following subsets: metropolitan area determined regions; regions representing a State’s territory outside metropolitan regions; and regions identified as entire states, within which no FAF metropolitan regions exist. Metropolitan regions do not cross State boundaries. Eight international trade regions model U.S. exports and imports. Figure 10 and Figure 11 show FAF domestic and international zones. 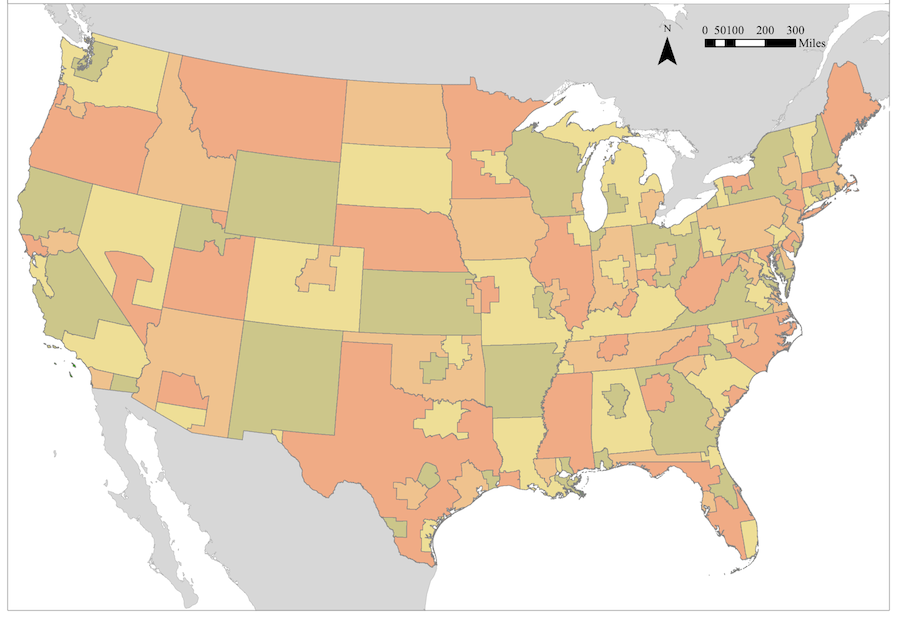
Figure 10. FAF Domestic Zones.
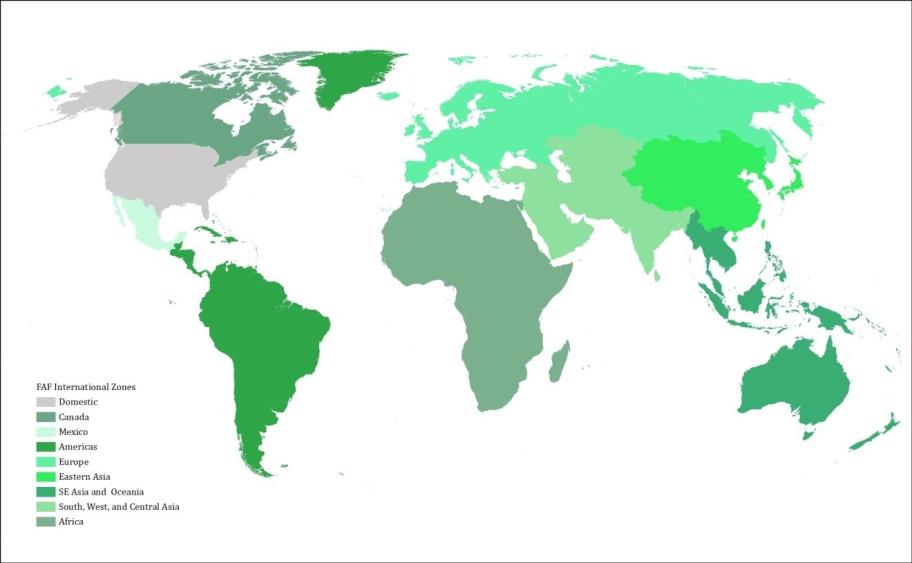
Figure 11. FAF International Zones.
The FAF4 has several data products, including a regional database and network database with highway flow assignment. The principal dimensions to the flow matrix are origin, destination, commodity, and mode. The 2012 freight flow matrix is used as the starting point for future-year forecasts, projecting volumes out to 2045. The FAF4 makes extensive use of the CFS data, but also relies on other data sources. FAF4 reports annual tonnage and dollar-valued freight flows using the 43, two-digit Standard Classification of Transported Goods (SCTG) commodity classes used by the 2012 CFS. FAF4 modes include truck, rail, water, air, multiple models, pipeline, and unknown. Employment and Establishment DataCounty Business Patterns (CBP) data contains the number of establishments in each size category, defined by industry and number of employees for each county in the United States. Industry is defined based on the North American Industrial Classification System (NAICS) six-digit classifications. The dataset is an annual series that provides county-level economic data, by industry type. This series includes the number of establishments, employment, and annual payroll. CBP data have been used to develop advanced freight models. The data are used to synthesize establishments in the supply chain model before allocating to analysis zones and selecting supplier/buyer pairs. CBP data does not contain foreign employment data and foreign firms need to be represented in the model. The primary objective of including foreign establishments in the model is to ensure that international flows between the region and foreign countries can be allocated to either buyers or supplier firms at the foreign country end. Another publicly available data is the Longitudinal Employer-Household Dynamics (LEHD) which is a national longitudinal job frame that combines data from State and federal sources to create a linked employer-employee dataset. These data are collated by the U.S. Census Bureau and cover approximately 90% of employed persons. LEHD data can be used to disaggregate the business locations for the regions of interest from the counties in the CBP data to the more detailed Traffic Analysis Zones (TAZs) used in the model TAZ system. LEHD and CBP data provide summaries of establishment-based employment, aggregated by U.S. county and organized by NAICS industry codes and establishment-size groupings. Like the commercial datasets, CBP and LEHD do not cover agriculture, construction, and public administration. Due to this lack of coverage, State and metropolitan transportation planning agencies in the United States typically supplement these data using State or local employment estimates, filling in missing sectoral employment and reconciling known local discrepancies. For instance, agriculture data on farms—by size and sales—can be derived from U.S. Department of Agriculture (USDA) Census of Agriculture data to provide supplemental data for understanding agricultural production locations. Agricultural establishments and employment are not well represented in CBP and LEHD data, and synthetic farms can be generated from other available data sources. Various tables from the USDA Census of Agriculture can be used to develop number of farms by county and NAICS industry codes to append to the CBP table to cover the missing agricultural industry establishment data. Employment on military bases is also not collected as part of the Economic Census, but it can be obtained on a case-by-case basis. Industry Economic Accounts DataThe U.S. Bureau of Economic Analysis (BEA) produces Input-Output (IO) "Make" and "Use" tables that report the value of goods consumed by each buyer industry. This can be used to identify the most important consumed commodities (by dollar value) and their associated supplier industries. These tables show production relationships among nearly 400 industries and commodities. Table 2 is an example of the information content of a "Use" table. These tables can also be used to spatially apportion commodity flows by commodity type and industry. DATA AND RESOURCE ASSESSMENTThere are multiple potential data sources used by agencies to estimate, calibrate, and validate the forecasting of a freight modeling system. Table 3 summarizes primary data sources used for behavioral supply chain freight models and includes details on each data source. The table does not include observed data (e.g., truck counts, Weigh-in-Motion [WIM] data) or local survey data available from local agencies.
Source: (United States Bureau of Economic Analysis, 2017)
1 The latest detailed (by six-digit NAICS) Input-Output table available is for 2007. [Return to Table Note 1] Data Available for Model InputsBehavioral supply chain freight models often use the following six types of model input data:
Freight flows have been typically included as an input in the models, since there are datasets (i.e., Freight Analysis Framework) that are publicly available. The Freight Analysis Framework and other freight flow datasets provide a version of the future based on a specific economic forecast. Including a procurement market model that produces freight flow forecasts based on economic and infrastructure forecasts in the freight model introduces more transparency and sensitivity into the freight forecasting process. Availability of Data for Estimating Model ParametersNational DataData for estimating behavioral supply chain freight model parameters requires disaggregate data, which is difficult to obtain. Data from national, State, or regional surveys is difficult and costly to collect. Thus, these data are collected infrequently or with small sample sizes. National surveys commonly used for model estimation by agencies include the following:
Establishment SurveysSeveral states and regional transportation agencies have conducted establishment surveys, but only the establishment surveys that are combined with commercial vehicle diary surveys can be used effectively to estimate model parameters for behavioral supply chain models. The following agencies contacted as part of this synthesis have used these types of surveys:
Both the MAG and Portland surveys employed smartphone mobile applications to collect data, which provided more detailed and accurate truck travel data. Challenges around recruitment of establishments and drivers to participate in these surveys continue, which is the primary reason for high survey costs. GPS DataPassively collected GPS data offer a partial solution to the challenge of collecting data on commercial vehicles. GPS data typically includes data on travel time, origin-destination, and time of travel. Private vendors (e.g., ATRI, Streetlight) offer large samples of GPS data with these data. Also, private vendors (i.e., EROADS, INRIX) provide additional attributes on commercial vehicle travel, such as truck type, commodity or industry group, and weight. Private firms also collect their own data to monitor fleets, and transportation agencies can request these data. Many private firms will not share their proprietary data, but sharing these data offers a low-cost solution to the commercial vehicle data challenges; these data also contain additional attributes over the larger samples provided by GPS data vendors. Data for Model Calibration and ValidationTravel demand modeling best practice includes selecting different data sources for model calibration and validation than those used in model estimation. This practice has not always been possible given limited data availability for the development of behavioral supply chain freight models. Available data sources identified for model calibration and validation typically fall into five categories:
1 The CFS Data (enumerated web address: https://www.census.gov/econ/cfs/) [Return to Note 1] 2 The CFS PUM Data (enumerated web address: https://www.census.gov/econ/cfs/pums.html) [Return to Note 2] 3 FAME Survey Project (enumerated web address: https://apps.ict.illinois.edu/projects/getfile.asp?id=3074) [Return to Note 3] 4 Vehicle Inventory and Use Survey - Discontinued (enumerated web address: https://www.census.gov/svsd/www/vius/2002.html) [Return to Note 4] | |||||||||||||||||||||||||||||||||||||||||||||||||||||||||||||||||||||||||||||||||||||||||||||||||||||||||||||||||||||||||||||||||||||||||||||||||||||||||||||||||||||||||||||||||||||
|
United States Department of Transportation - Federal Highway Administration |
||